UNITED STATES
SECURITIES AND EXCHANGE COMMISSION
Washington, D.C. 20549
FORM
ANNUAL REPORT PURSUANT TO SECTION 13 OR 15(d) OF THE SECURITIES EXCHANGE ACT OF 1934: |
For the fiscal year ended
OR
TRANSITION REPORT PURSUANT TO SECTION 13 OR 15(d) OF THE SECURITIES EXCHANGE ACT OF 1934 |
Commission File No.
(Exact name of registrant as specified in its charter)
(State or other jurisdiction of incorporation or organization) |
(I.R.S. Employer Identification No.) |
|
|
(Address of principal executive offices) |
(Zip Code) |
Registrant’s telephone number, including area code: (
Securities registered pursuant to Section 12(b) of the Act:
Title of each class |
Trading Symbol(s) |
Name of Exchange on which registered |
Securities registered pursuant to Section 12(g) of the Act: None
Indicate by check mark if the registrant is a well-known seasoned issuer, as defined in Rule 405 of the Securities Act.
Indicate by check mark if the registrant is not required to file reports pursuant to Section 13 or Section 15(d) of the Act. Yes ☐
Indicate by check mark whether the registrant (1) has filed all reports required to be filed by Section 13 or 15(d) of the Securities Exchange Act of 1934 during the preceding 12 months (or for such shorter period that the registrant was required to file such reports), and (2) has been subject to such filing requirements for the past 90 days.
Indicate by check mark whether the registrant has submitted electronically every Interactive Data File required to be submitted pursuant to Rule 405 of Regulation S-T (Section 232.405 of this chapter) during the preceding 12 months (or for such shorter period that the registrant was required to submit such files).
Indicate by check mark whether the registrant is a large accelerated filer, an accelerated filer, a non-accelerated filer, a smaller reporting company, or an emerging growth company. See the definitions of “large accelerated filer,” “accelerated filer,” “smaller reporting company,” and “emerging growth company” in Rule 12b-2 of the Exchange Act.
☒ |
Accelerated filer |
☐ |
Non-accelerated filer |
☐ |
|
|
|
|
|
|
|
Smaller reporting company |
Emerging growth company |
|
|
If an emerging growth company, indicate by check mark if the registrant has elected not to use the extended transition period for complying with any new or revised financial accounting standards provided pursuant to Section 13(a) of the Exchange Act. ☐
Indicate by check mark whether the registrant has filed a report on and attestation to its management’s assessment of the effectiveness of its internal control over financial reporting under Section 404(b) of the Sarbanes-Oxley Act (15 U.S.C. 7262(b)) by the registered public accounting firm that prepared or issued its audit report.
If securities are registered pursuant to Section 12(b) of the Act, indicate by check mark whether the financial statements of the registrant included in the filing reflect the correction of an error to previously issued financial statements
Indicate by check mark whether any of those error corrections are restatements that required a recovery analysis of incentive-based compensation received by any of the registrant's executive officers during the relevant recovery period pursuant to §240.10D-1(b). ☐
Indicate by check mark whether the registrant is a shell company (as defined in Rule 12b-2 of the Exchange Act). Yes ☐ No
The aggregate market value of the voting stock held by nonaffiliates of the registrant was $
DOCUMENTS INCORPORATED BY REFERENCE
Part III is incorporated by reference from the Proxy Statement for the Annual Meeting of Shareholders to be held on May 2, 2025.
Auditor Firm Id: |
Auditor Name: |
Auditor Location: |
M |
Table of Contents |
ManpowerGroup Inc.
Form 10-K
For the Fiscal Year Ended December 31, 2024
TABLE OF CONTENTS
|
|
Page Number |
|
|
|
|
|
|
3 |
||
11 |
||
25 |
||
26 |
||
26 |
||
26 |
||
26 |
||
|
Information About Our Executive Officers |
27 |
|
28 |
|
|
|
|
|
|
|
29 |
||
30 |
||
Management's Discussion and Analysis of Financial Condition and Results of Operations |
31 |
|
42 |
||
45 |
||
Changes in and Disagreements with Accountants on Accounting and Financial Disclosure |
88 |
|
88 |
||
88 |
||
Disclosures Regarding Foreign Jurisdictions that Prevent Inspections |
88 |
|
|
|
|
|
|
|
89 |
||
89 |
||
Security Ownership of Certain Beneficial Owners and Management and Related Stockholder Matters |
90 |
|
Certain Relationships and Related Transactions, and Director Independence |
90 |
|
90 |
||
|
|
|
|
|
|
91 |
||
94 |
||
|
|
|
|
95 |
|
|
|
|
Part I |
PART I
The terms “we,” “our,” “us,” "ManpowerGroup," or “the Company” refer to ManpowerGroup Inc. and its consolidated subsidiaries.
Item 1. Business
Introduction and History
ManpowerGroup Inc. is a global leader in innovative workforce solutions. Through our network of over 2,100 offices in approximately 75 countries and territories, we put millions of people to work each year with our global, multinational and local clients across all major industry segments. Our strong and distinct brands provide specialized solutions that drive organizations forward, accelerate individual success and help build more sustainable communities. We power the future of work.
By offering a comprehensive range of workforce solutions and services, we help companies improve strategy, quality, and efficiency, increase productivity and reduce costs across their workforce to achieve their business goals. ManpowerGroup’s offerings of innovative workforce solutions and services includes:
Our expert family of global brands - Manpower, Experis and Talent Solutions - provide innovative workforce solutions across the globe for hundreds of thousands of organizations every year.
Manpower is a global leader in contingent staffing and permanent recruitment, providing strategic and operational flexibility to organizations and connecting people to meaningful work while helping them develop skills to stay employable. With our data driven insight into people’s motivation, skills adjacencies, and performance potential, we provide learning programs, on the job training and market based certifications for rapid reskilling and upskilling at scale.
Experis is a global leader in information technology (IT) professional resourcing and project services specializing in Enterprise Applications, Business Transformation, Cloud and Infrastructure, Digital Workspace and Cyber Security. As digital transformation and skills shortages continue in the technology field, Experis provides talent with the combination of in-demand technical skills together with the soft skills that are critical for business success.
Talent Solutions combines leading global offerings Recruitment Process Outsourcing (RPO), TAPFIN - Managed Service Provider (MSP) and Right Management to provide data-driven capabilities that help organizations with their workforce transformation. Talent Solutions helps organizations more effectively source, manage and develop talent at scale. From talent attraction and acquisition to upskilling, development and retention, we leverage our integrated HR tech stack PowerSuite to deliver workforce solutions across multiple countries at scale.
3
Part I |
Our leadership position enables us to be a pathway to quality employment opportunities for people at all points in their career journey and we have connected people to meaningful work for over 75 years. Governments and policy makers in the markets where we operate look to us to provide employment advice, opportunities and training to assist the unemployed in gaining the skills they need to enter the workforce, providing a bridge to employment and helping build more sustainable communities.
We, and our predecessors, have been in business since 1948 when we were incorporated as a Wisconsin corporation, and have had our shares listed on the New York Stock Exchange since 1967.
Our website is www.manpowergroup.com. The Investor Relations section (investor.manpowergroup.com) provides our annual reports on Form 10-K, quarterly reports on Form 10-Q, current reports on Form 8-K, and amendments to those reports filed or furnished pursuant to Section 13(a) of the Securities Exchange Act of 1934 as soon as reasonably practicable after we electronically file such material with, or furnish it to, the Securities and Exchange Commission. In addition, we also make available through our website:
Documents available on the website are also available in print for any shareholder who requests them. Requests may be made by writing to Secretary, ManpowerGroup, 100 Manpower Place, Milwaukee, Wisconsin 53212. We are not including the information contained on or available through our website as a part of, or incorporating such information by reference into, this Annual Report on Form 10-K.
Our Operations
Client demand for workforce solutions and services is dependent on the overall strength of the labor market and secular trends toward greater workforce flexibility within each of the segments where we operate. Improving economic growth typically results in increasing demand for labor, resulting in greater demand for our workforce solutions and staffing services while demand for our outplacement services typically declines. During periods of increasing demand, we are generally able to improve our profitability and operating leverage as our cost base can support some increase in business without a similar increase in selling and administrative expenses.
Correspondingly, during periods of weak economic growth or economic contraction, the demand for our staffing services typically declines, while demand for our outplacement services typically accelerates. When demand drops, our operating profit is typically impacted unfavorably as we experience a deleveraging of our selling and administrative expense base as expenses may not decline at the same pace as revenues. In periods of economic contraction, we may have more significant expense deleveraging, as we believe it is prudent not to reduce selling and administrative expenses to levels that could negatively impact the long-term potential of our branch network and brands.
4
Part I |
The nature of our operations is such that our most significant current asset is accounts receivable, with a days sales outstanding of 52 days as of December 31, 2024. Our most significant current liabilities are payroll related costs, which are generally paid either weekly or monthly. As the demand for our services increases, we generally see an increase in our working capital needs, as we continue to pay our associates on a weekly or monthly basis while the related accounts receivable is outstanding for much longer, which may result in a decline in operating cash flows.
Conversely, as the demand for our services declines, we generally experience a decrease in our working capital needs, as the existing accounts receivable are collected and not replaced at the same level, resulting in a decline of our accounts receivable balance, with less of an effect on current liabilities due to the shorter cycle time of the payroll related items. While this may result in an increase in our operating cash flows, longer payment terms and timing of payroll, tax and supplier related payments significantly impact our cash positions and cash flows each period. Any increase in operating cash flows from an economic slowdown would not be sustained in the event that a downturn continues for an extended period.
Due to our industry’s sensitivity to economic factors, the inherent difficulty in forecasting the direction and strength of the economy and the short-term nature of staffing assignments, it is difficult to forecast future demand for our services with certainty. As a result, we monitor a number of economic indicators, as well as recent business trends, to predict future revenue trends for each of the countries and territories where we operate. Based upon these anticipated trends, we determine what level of personnel and office investments are necessary to take full advantage of growth opportunities.
During the last several years, secular trends toward greater workforce flexibility have impacted the demand for our innovative workforce solutions and services around the world. As companies attempt to increase the variability of their cost base, the workforce solutions we provide help them to effectively address the fluctuating demand for their products or services. As the global economy continues to grow and adapt with new technology, we are helping clients manage their workforce transformation and ensure they have the right skills now and in the future. Whether it is through workforce assessments, targeted training or by creating longer-term development paths, we help organizations and candidates adapt their skills to changing workforce needs.
Our portfolio of recruitment services includes permanent, temporary and contract recruitment of professionals, as well as administrative, industrial and IT professional positions. These services are provided under our Manpower and Experis brands. We have provided services under our core Manpower brand for over 75 years with a primary focus on the areas of office and industrial services and solutions. Our Talent Based Outsourcing offering within our Manpower brand includes outcome-based solutions such as management of financial and administrative processes, including call center and customer service activities.
We provide IT resourcing and services under our Experis brand. Our experience and expertise allow us to accurately assess candidates’ workplace potential and technical skills to match them to the needs of our clients. We plan to continue to build our Experis brand and attract the talent our clients need as skills shortages arise or continue.
Our Talent Solutions brand specializes in the delivery of customized workforce strategies and new solutions and creating added value that addresses our clients’ complex global workforce needs. Through our RPO offering, we manage customized, large-scale recruiting and workforce productivity initiatives for clients through exclusive outsourcing contracts. We can manage a single element or all of a client's permanent recruiting and hiring processes, from job profiling to on-boarding, globally or in a single location. MSP services include overall program management, reporting and tracking, supplier selection and management and order distribution. The MSP and RPO offerings both provide specialty expertise in contingent workforce management and broader administrative functions. Our Right Management offering includes our career management services that have historically been counter-cyclical to our staffing services, which helps to offset the impact of an economic downturn on our overall financial results.
Americas
We provide services as Manpower, Experis and Talent Solutions through both branch and franchise offices. The Americas segment had 416 branch and 137 franchise offices as of December 31, 2024. In the United States, where we realized 65% of the Americas’ revenue, we had 288 branch and 130 franchise offices as of December 31, 2024, as well as on-site locations at clients with significant permanent, temporary and contract recruitment requirements. In Other Americas, the largest operations of which include Canada, Mexico and Colombia, we had 128 branch and 7 franchise offices as of December 31, 2024. We provide a number of central support services to our branches and franchises, which enable us to maintain consistent service quality throughout the region regardless of whether an office is a branch or franchise.
5
Part I |
Our franchise agreements provide the franchisee with the right to use the Manpower® service mark in a specifically defined exclusive territory. In the United States, franchise fees generally range from 2% to 3% of franchisee sales. Our franchise agreements provide that in the event of a proposed sale of a franchise to a third party, we have the right to acquire the franchise at the same price and on the same terms as proposed by the third party. We have exercised this right in the past and may do so in the future if opportunities arise.
Our Manpower and Experis operations provide a variety of workforce solutions and services, including permanent, temporary and contract recruitment, assessment and selection, and training. Our Talent Solutions operations provide a variety of workforce solutions offerings including RPO, MSP and Right Management. During 2024 in this segment, 90% of revenues were derived from our staffing/interim services, 4% from permanent recruitment services, 2% from outcome-based solutions and consulting and 4% from other services.
Southern Europe
We are a leading provider of permanent, temporary and contract recruitment, assessment and selection, training and outsourcing services throughout Europe. The Southern Europe segment had 1,166 branch offices as of December 31, 2024. Our largest operations in this segment are in France (56% of the segment revenue) and Italy (20% of the segment revenue).
We conduct our operations in France as a leading workforce solutions and service provider through 647 branch offices as Manpower, Experis and Talent Solutions, and 169 branch offices under the name Supplay as of December 31, 2024. The employment services market in France calls for a wide range of our services including permanent, temporary and contract recruitment, assessment and selection, and training. The temporary recruitment market is predominantly focused on recruitment for industrial positions. During 2024 in France, 91% of revenues were derived from our staffing/interim services, 1% from permanent recruitment services, 6% from outcome-based solutions and consulting and 2% from other services.
In Italy, we are a leading workforce solutions and services provider. As of December 31, 2024, ManpowerGroup Italy conducted operations through a network of 204 branch offices. It provides a comprehensive suite of workforce solutions and services offered through Manpower, Experis or Talent Solutions, including permanent, temporary and contract recruitment, assessment and selection, training and outsourcing. During 2024 in Italy, 93% of revenues were derived from our staffing/interim services, 3% from permanent recruitment services, 2% from outcome-based solutions and consulting and 2% from other services.
Northern Europe
Our largest operations in Northern Europe are in the United Kingdom, the Nordics, Germany, the Netherlands and Belgium providing a comprehensive suite of workforce solutions and services through Manpower, Experis, and Talent Solutions. Collectively, we operate through 282 branch offices in this region.
In the United Kingdom, where we have the largest operation in this segment, we are a leading provider of workforce solutions and services. As of December 31, 2024, we conducted operations in the United Kingdom as Manpower, Experis and Talent Solutions through a network of 46 branch offices and also provided on-site services to clients who have significant permanent, temporary and contract recruitment requirements. In the United Kingdom, we also conduct operations as Brook Street Bureau PLC, or Brook Street. Its core business is secretarial, office and light industrial recruitment. Brook Street operates as a local network of branches and competes primarily with local or regional independents. Brook Street’s revenues are comprised of temporary and contract placements as well as permanent recruitment.
During 2024 in Northern Europe, 85% of revenues were derived from our staffing/interim services, 4% from permanent recruitment services, 8% from outcome-based solutions and consulting and 3% from other services.
APME
We operate through 110 branch offices in the Asia Pacific Middle East (APME) region. The largest of these operations are located in Japan and India, which operate through branch offices. Our APME operations provide a variety of workforce solutions and services offered through Manpower, Experis and Talent Solutions, including permanent, temporary and contract recruitment, assessment and selection, training and outsourcing. During 2024 in this segment, 81% of revenues were derived from our staffing/interim services, 2% from permanent recruitment services, 15% from outcome-based solutions and consulting and 2% from other services.
6
Part I |
Competition
We compete in the employment services industry by offering a broad range of services, including permanent, temporary and contract recruitment, project-based workforce solutions, assessment and selection, training, career and talent management, managed service solutions, outsourcing, consulting and professional services.
Our industry is large and fragmented, comprised of thousands of firms employing millions of people and generating billions of United States dollars in annual revenues. In most areas, no single company has a dominant share of the employment services market. In addition to us, the largest publicly owned companies specializing in recruitment services are The Adecco Group and Randstad. We also compete against a variety of regional or specialized companies such as Recruit Holdings, Allegis Group, Kelly Services, Robert Half, Kforce, PageGroup, Korn/Ferry International and Alexander Mann. It is a highly competitive industry, reflecting several trends in the global marketplace such as the increasing demand for skilled people, employers’ desire for more flexible working models and consolidation among clients and in the employment services industry itself, as well as low entry costs for small firms wishing to compete in the industry, especially at the local level. We manage these trends by leveraging established strengths, including several of the employment services industry’s most recognized and respected brands; geographic diversification; size and service scope; an innovative product mix; recruiting and assessment expertise; and a strong client base. While staffing is an important aspect of our business, our strategy is focused on providing both the skilled employees our clients need and higher-value workforce management, outsourcing and consulting solutions.
Our client mix consists of both small- and medium-size businesses, and large national and multinational clients. Client relationships with small- and medium-size businesses are based on a local or regional relationship, and tend to rely less on longer-term contracts, and the competitors for this business are primarily locally-owned businesses. On the other hand, the large national and multinational clients, which comprised approximately 60% of our revenues in 2024, will frequently enter into non-exclusive arrangements with several firms, with the ultimate choice among them being left to local managers. As a result, employment services firms with a large network of offices compete most effectively for this business which generally has agreed-upon pricing or mark-up on services performed.
Legal Regulations
The employment services industry is closely regulated in all of the major markets in which we operate, except the United States, the United Kingdom, Canada and Australia. Employment services firms are generally subject to one or more of the following types of government regulation:
In many markets, the existence or absence of collective bargaining agreements with labor organizations has a significant impact on our operations and the ability of clients to use our services. In some markets, labor agreements are structured on an industry-wide, rather than company-by-company, basis. Changes in these collective bargaining agreements have occurred in the past and are expected to occur in the future and may have a material impact on the operations of employment services firms, including us.
In most countries, workforce solutions and services firms are considered the legal employers of temporary and contract workers. Therefore, laws regulating the employer/employee relationship, such as tax withholding or reporting, social security or retirement, health and other benefits, anti-discrimination and workers’ compensation, govern the firm.
In many countries, particularly in continental Europe and Asia, entry into the employment services market is restricted by the requirement to register with, or obtain licenses from, a government agency. In addition, a wide variety of ministerial requirements may be imposed, such as record keeping, written contracts and reporting. The United States, United Kingdom and Canada do not presently have any form of national registration or licensing requirement.
7
Part I |
In addition to licensing or registration requirements, many countries impose substantive restrictions on the use of temporary and contract workers. Such restrictions include regulations affecting the types of work permitted, the maximum length of assignment, wage levels or reasons for which temporary and contract workers may be employed. In some countries, special taxes, fees or costs are imposed in connection with the use of temporary and contract workers. For example, temporary and contract workers in France are entitled to a 10% allowance for the uncertain duration of employment, which is eliminated if a full-time position is offered to them after assignment termination.
Our outplacement and consulting services generally are not subject to governmental regulation in the markets in which we operate.
In the United States, we are subject to various federal and state laws relating to franchising, principally the Federal Trade Commission’s Franchise Rules and analogous state laws which impact our agreements with our franchised operations. These laws and related rules and regulations impose specific disclosure requirements. Virtually all states also regulate the termination of franchises.
Changes in applicable laws or regulations have occurred in the past and are expected in the future to affect the extent to which workforce solutions and services firms may operate. These changes could impose additional costs, taxes, record keeping or reporting requirements; restrict the tasks to which contingent workers may be assigned; limit the duration of or otherwise impose restrictions on the nature of the relationship (with us or the client); or otherwise adversely affect the industry.
Trademarks
We maintain a number of registered trademarks, trade names and service marks in the United States and various other countries and territories. We believe that many of these marks and trade names, including ManpowerGroup®, Manpower®, Experis®, Right Management®, Brook Street®, Jefferson Wells®, Supplay®, PowerSuite® and MyPath® have significant value and are materially important to our business. In addition, we maintain other intangible property rights. The trademarks have been assigned an indefinite life based on our expectation of renewing the trademarks, as required, without material modifications and at a minimal cost, and our expectation of positive cash flows beyond the foreseeable future.
Employees
We had approximately 26,700 full-time equivalent employees as of December 31, 2024. In addition, we recruit millions of permanent, temporary and contract workers on a worldwide basis each year on behalf of our clients.
As described above, in most jurisdictions, we, as the employer of our temporary and contract workers or as otherwise required by applicable law, are responsible for employment administration. This administration includes collection of withholding taxes, employer contributions for social security or its equivalent outside the United States, unemployment tax, workers’ compensation and fidelity and liability insurance, and other governmental requirements imposed on employers. In most jurisdictions where such benefits are not legally required, including the United States, we provide health and life insurance, paid holidays and paid vacations to qualifying temporary and contract employees.
Human Capital
We Are a Workforce Solutions and Human Capital Company.
Human capital management is at the core of our business. Our purpose is to provide meaningful and sustainable employment and is rooted in our values: People, Knowledge and Innovation. Our 26,700 employees, spanning approximately 75 countries, help improve the lives of approximately 500,000 workers daily by providing guidance, advice, assessments, coaching, upskilling, reskilling and pathways to long-term sustainable employment. These efforts support local economies by increasing employability and opportunity for the millions of lives that we reach each year.
Through our sustainability report Working to Change the World, we report progress on our People & Prosperity pillar, where we are focused on being Creators of Talent at Scale, championing diversity, and improving employability and prosperity. For over 75 years, we have developed global insights on the issues and trends impacting organizations and individuals in today’s fast changing world of work. Our own research and solutions, coupled with partnerships with clients and Non-Governmental Organizations (e.g. World Economic Forum, World Employment Confederation and Junior Achievement, among others), enable us to advance the global discussion around the future of work and future for workers. These include the impact of digitization and generative AI, the green transition and shift in in-demand skills, exacerbating talent shortages, and the increased need for reskilling and upskilling. Our most recent annual Talent Shortage Survey reported that 74% of companies cannot find the skilled workers they need.
8
Part I |
We Seek to Create Talent at Scale.
Our Manpower MyPath program is designed to deliver targeted upskilling at speed and scale to our Manpower associates in order to accelerate their employability at higher wage levels, while also growing the pool of in-demand talent for our clients. Through this program, Manpower recruiters provide personalized and data-driven guidance, development, training, and access to jobs especially in growth sectors including advanced manufacturing, information technology, supply chain and customer service. MyPath has impacted over 270,000 lives through 2024, and MyPath associates now represent 30% of our associate talent pool in MyPath certified countries, across over 14,000 clients and 12 markets.
We are also targeting the creation of IT talent through our Experis Academy. This accelerated development program features custom-designed curricula to upskill people into specialized roles that can meet the demand for cloud, infrastructure, business transformation and digital workforce skills. Paired with coaching and soft skills training, upon completion most Academy graduates receive a permanent job offer from our clients. Through the end of 2024, we have trained more than 4,500 developers while also bridging the skills gaps for more than 170 tech companies across approximately 20 countries.
We Are Focused on Strengthening Our Culture and Developing Our People.
Our Global Footprint
We have a global footprint, though our teams are managed locally: 31% of our people are in the Americas, 33% in Southern Europe, 19% in Northern Europe and 17% in Asia Pacific/Middle East.
Developing our People
We believe our success in creating value for individuals and organizations around the world will depend on our ability to leverage the potential of our own people. We are investing in our people to support both our strategic ambitions and their personal goals.
In 2024, we continued to broaden and deepen our investment through our Leadership Development Programs, incorporating the 3 E’s of our development philosophy: Education, Exposure and Experience.
Upon completion of these programs, the majority of our participants have made positive leadership career moves.
Strengthening our Culture
We believe that all people deserve to feel safe, respected and able to thrive in the workplace. Our focus encompasses four areas of focus : (1) globally, support gender diversity at leadership levels; (2) locally, address a second dimension of diversity based on gaps or opportunities within a country; (3) culturally, foster an inclusive environment that supports our diverse workforce; and (4) societally, advance employment security for workers while promoting upskilling, well-being, flexibility and income opportunity.
9
Part I |
Our Board of Directors has exceeded 30% gender diversity for more than 10 years. As of December 31, 2024, 18% are racially diverse and 36% are non-US born. Our Executive Leadership Team, which reports directly to the CEO, is 30% women, 40% racially diverse and 70% non-US born. Our Global Leadership Team, the top 86 leaders in the company, is 38% women. Gender diversity across all our markets globally aligns to our values. We will continue to develop our talent across all markets and at all levels, including working to ensure that the gender diversity of our leadership is aligned to the representation of the organization. Diversity in our workplaces also means that we prioritize people’s health and wellbeing and have committed to flexible work models across the globe to attract, engage and retain our people. In several markets, we have launched initiatives and trained our managers to promote greater awareness of mental wellbeing. We see diversity as a strategic enabler of our business and therefore we are focused on actions to support our diverse organization, our culture and the impact we have on the communities we serve across the globe.
Additionally, encouraging active engagement among our workforce is important for nurturing a strong and inclusive culture. We believe regular pulse surveys offer valuable insights into employee sentiments, spanning various areas such as the effectiveness of our People & Culture strategy, leadership assessments, ethics, values, and developmental opportunities. Our Culture Matters initiative has been refined, and we incorporated these behaviors into Our Standards. Our business strategy guides our actions for achieving our goals, and the behaviors in Our Standards—Clarity, Care, and Grow— illustrate how we execute these strategies. We believe our global leaders should provide clarity to our people and our clients, care about themselves and others through our people practices, and make decisions that grow our business and ourselves. Our core belief is that for ManpowerGroup to be successful, each of us needs to be accountable to delivering on these at all levels of our organization.
In 2024, we conducted a global employee survey with over 22,000 staff participating, achieving an 80% response rate. Over 11,000 employees left nearly 26,000 comments to help leaders improve the employee experience at ManpowerGroup.
10
Part I |
Item 1A. Risk Factors
FORWARD-LOOKING STATEMENTS
This Annual Report on Form 10-K contains forward-looking statements within the meaning of Section 27A of the Securities Act of 1933, as amended, and Section 21E of the Exchange Act of 1934, as amended, (each a "forward-looking statement"). Statements made in this report that are not statements of historical fact are forward-looking statements. In addition, from time to time, we and our representatives may make statements that are forward-looking. Forward-looking statements are based on management’s current assumptions and expectations and are subject to risks and uncertainties that are beyond our control. This section provides you with cautionary statements identifying, for purposes of the safe harbor provisions of the Private Securities Litigation Reform Act of 1995, important factors that could materially adversely affect our business, operational and financial results and cash flows. In addition, these factors could cause our actual results to differ materially from those contained in forward-looking statements made in this report or otherwise made by us or on our behalf. You can identify these forward-looking statements by forward-looking words such as “expect”, “anticipate”, “intend”, “plan”, “may”, “will”, “believe”, “seek”, “estimate”, and similar expressions. You are cautioned not to place undue reliance on these forward-looking statements. We caution that any forward-looking statement reflects only our belief at the time the statement is made. We undertake no obligation to update any forward-looking statements to reflect subsequent events or circumstances.
The following are some of the factors that could materially adversely affect our business, operational and financial results and cash flows or cause actual results to differ materially from estimates contained in our forward-looking statements. Risks in this section are grouped in the following categories: (1) Company and Operational Risks; (2) Strategic Risks; (3) Financial and Market Risks; and (4) Regulatory and Legal Risks. Many risks affect more than one category, and the risks are not in order of significance or probability of occurrence because they have been grouped by categories.
Company and Operational Risks
Strategic Risks
11
Part I |
Financial and Market Risks
Regulatory and Legal Risks
Some or all of these factors may be beyond our control. We caution you that any forward-looking statement reflects only our belief at the time the statement is made. We undertake no obligation to update any forward-looking statement to reflect events or circumstances after the date on which the statement is made.
RISK FACTORS
In addition to the other information set forth in this report, you should carefully consider the following factors which could materially adversely affect our business, financial condition, results of operations (including revenues and profitability) or stock price. Our business is also subject to general risks and uncertainties that may broadly affect companies. Additional risks and uncertainties not currently known to us or that we currently deem to be immaterial also could materially adversely affect our business, financial condition, results of operations or stock price.
Company and Operational Risks
Our results of operations have been and may in the future be materially adversely affected by volatile, negative, or uncertain economic conditions, including the risk of recession.
Our business is sensitive to changes in global macroeconomic conditions. We have at times experienced uncertainty and volatility in global economic conditions, including in rates of growth or decline in the markets we serve. Our operating countries and regions, which are increasingly interdependent, have experienced periods of volatile growth patterns or declines, and we expect that global conditions will continue to be characterized by instability and unpredictability. Such conditions have and may continue to cause our clients to reduce or defer their spending on new projects that require our solutions which could decrease demand for our various staffing services. If our business growth is slow, or if it contracts for an extended period of time, this could have a material adverse effect on our business and results of operations.
12
Part I |
Our profitability is sensitive to decreases in demand. Based on current macroeconomic conditions, there is a significant risk that some of our most important markets will experience a recession, which would likely be accompanied by a decline in demand for our services. When demand drops or remains low, our operating profit is impacted unfavorably as we experience a deleveraging of our selling and administrative expense base as expenses do not decline as quickly as revenues. For example, our ability to achieve cost containment through reductions in our headcount may be impeded or slowed by applicable legal requirements to consult with employee representative bodies such as works councils. In periods of decline, we may not be able to reduce selling and administrative expenses without negatively impacting the long-term potential of our branch network and brands. Additionally, some clients may slow the rate at which they pay us, or become unable to pay their obligations and our cash flow and profitability may suffer.
Economic conditions in the countries and territories where we do business may be affected by recent or emerging events, such as the rise of populism, political volatility, civil violence and unrest, election results or other changes in ruling parties or governmental leadership, trade disputes, protectionism or changes in global trade policies, capital flows, the global refugee crisis, social justice movements, energy shortages or instability in the global energy market, global health crises, changes in immigration policy, the impact of supply chain challenges on our clients, changes in employment policy, changes in interest rates, inflation, the impact of terrorist activity, or by other political or economic developments. In addition, there is a risk the current inflationary environment and efforts to combat inflation could have an impact on the countries and territories where we do business. We are particularly susceptible to changes in demand patterns and economic conditions in Europe, which represents two of our operating segments and 64% of our revenue.
There is a risk that economic conditions in European markets or elsewhere may continue to be negatively impacted by geopolitical events. In recent years these have included labor unrest, civil protest, heightened trade tensions, refugee crises, and military conflicts, including the ongoing conflicts between Russia and Ukraine and Israel and Hamas. We cannot predict the potential consequences arising from these conflicts and the further escalation of geopolitical tensions globally, including whether they could have an effect on the global economy and on our business and results of operations. Geopolitical events could give rise to the imposition of further sanctions, regional or international expansion of current conflicts, instability in energy supplies, potential retaliatory action by governments, heightened cybersecurity threats, disruptions in the global supply chain, volatility in foreign exchange rates, and inflationary pressures. Any of these events or trends could have a material adverse effect on our business and operating results, particularly our European operations.
There is a risk that even when overall global economic conditions are positive, we could experience declines in all, or in portions, of our business. During past periods of recovery, we have experienced inconsistent results, with some geographical regions, or countries within a region, suffering declines or weakness in economic activity while others improve. Differing economic conditions and patterns of economic growth or contraction may affect demand for our solutions and services, and there is a risk that, even during times of strengthening global economic conditions, we may not experience uniform, or any, increases in demand for our solutions and services within the markets where our business is concentrated.
Even without uncertainty and volatility, it is difficult for us to forecast future demand for our services due to the inherent difficulty in forecasting the direction and strength of economic cycles, and the short-term nature of many of our staffing assignments. When it is difficult for us to accurately forecast future demand, we may not be able to determine the optimal level of personnel and office investments necessary to profitably operate our business or take advantage of growth opportunities.
We may lack the speed, agility, and resiliency to effectively operate our business and respond to the needs of our clients.
There is a risk we may not be able to respond with sufficient speed and agility to the needs of our diverse clients, which span all industries and whose needs may change rapidly as their businesses and industries evolve. The size and breadth of our organization, comprising approximately 26,700 employees based out of over 2,100 offices in approximately 75 countries and territories, may make it difficult for us to effectively manage our resources, to maintain our corporate culture throughout the organization, to drive service improvements and to provide coordinated solutions to our clients who require our services in multiple locations. For example, client demands for uniform service across borders may be difficult to satisfy because of variation in local laws and customs. We see a trend in more multi-country and enterprise-level relationships, and we may have difficulty in profitably managing and delivering projects involving multiple countries. Also, our size and organizational structure may make it difficult to develop and implement new processes and tools across the enterprise in a consistent manner. If we are not effective at anticipating or meeting the widely ranging needs of our current and prospective clients, or our competitors are more agile or effective at doing so, our business and financial results could be materially adversely affected.
13
Part I |
Our ability to perform at speed, and to meet client expectations, may also be adversely affected by limitations in our own information systems and those of our third-party vendors. We are increasingly dependent on these systems, which are subject to damage or interruption from multiple causes, including power outages, facility damage, computer and telecommunications failures, vandalism, malware, hacking and other malicious acts, catastrophic events and human error. If our information systems are damaged, fail to work properly, or otherwise become unavailable, we may incur substantial costs to repair or replace them, and may experience reputational damage, loss of critical information, customer disruption, and interruptions or delays in our ability to perform essential functions and implement new and innovative services.
The worldwide employment services industry is highly competitive with limited barriers to entry in many markets, which could limit our ability to maintain or increase our market share or profitability.
The worldwide employment services industry is highly competitive with limited barriers to entry in many markets, and in recent years has undergone significant consolidation. We compete in markets throughout the world with full-service and specialized employment services agencies. Several of our global competitors have very substantial marketing and financial resources and may be better positioned in certain markets. Portions of our industry may become increasingly commoditized, with the result that competition in key areas could become more focused on pricing. We expect that we will continue to experience pressure on price from competitors and clients. There is a risk that we will not compete effectively, including on price, which could limit our ability to maintain or increase our market share and could materially adversely affect our financial results. This may worsen as clients increasingly take advantage of low-cost alternatives including using their own in-house resources rather than engaging a third party. The increased availability and maturation of artificial intelligence (AI) tools may enable clients to use advanced automation capabilities in lieu of services provided by our employees, contractors and associates.
We could incur liabilities or suffer reputational damage from a cyberattack or improper disclosure or loss of personal or confidential data, and our use of data is subject to complex and ever-changing privacy and cybersecurity legal requirements that could negatively impact our business or subject us to claims and/or fines for non-compliance.
In connection with the operation of our business, we store, process and transmit a large amount of data, including personnel and payment data, about our employees, clients, associates and candidates, a portion of which is personal data and/or confidential data. We expect our use of data to increase, including through the use of analytics, AI and machine learning (ML). In engaging in these data-related activities, we rely on our own technology systems and software, and those of third-party vendors we use for a variety of processes, including, but not limited to cloud-based technology and systems, mobile technologies and social media. Unauthorized access to, disclosure, modification, use or loss of personal or confidential data may occur through various methods. These include, but are not limited to, ransomware, systems failure, employee negligence or malfeasance, fraud or misappropriation, or unauthorized access to or through our information systems, whether by our employees, vendors or third parties, including a cyberattack by hackers, members of organized crime and/or state-sponsored organizations, who may develop and deploy supply chain interruptions, social engineering attacks, viruses, worms or other malicious software programs, or obtain credentials to our systems through other unrelated cyberattacks.
An incident involving disclosure, system failure, data modification, loss or security breach could harm our reputation and subject us to significant monetary damages or losses, litigation, negative publicity, regulatory enforcement actions, fines, criminal prosecution, as well as liability under our contracts and laws that protect personal and/or confidential data, resulting in increased costs or loss of revenues. Cybersecurity threats continue to increase in frequency and sophistication, thereby increasing the difficulty of detecting and defending against them. In the past, we have experienced data security breaches resulting from unauthorized access to our systems and other fraudulent activities, such as social engineering, which to date have not had a material impact on our operations or financial results. We regularly engage an independent external security firm to assess our defenses to a potential cyberattack, and these assessments may uncover new or additional vulnerabilities and weaknesses that could lead to a compromise of our systems and/or a loss of personal data. In a recent evaluation, vulnerabilities were identified that could facilitate or contribute to a security incident involving personal data. The assessment firm was able to penetrate defensive protections adopted by us, as well as protections that we obtain from third party providers. We are prioritizing the resolution of security gaps that could lead to a loss of personal data or to other damage. Despite our efforts to identify and address vulnerabilities in our systems, vulnerabilities in software products used by us are disclosed by our software providers on a daily basis, and attackers grow continuously more sophisticated in their attack methods, which may additionally make use of AI technology such as AI-generated 'deep-fake' impersonation or social engineering, making it impossible to give assurance that our cybersecurity efforts will be successful.
14
Part I |
There is a risk that our and our third-party vendors’ preventative security controls and practices will be inadequate to prevent unauthorized access to, disclosure of, or loss of personal and/or confidential data, or fraudulent activity, especially given that third party attacks have become more common. In the past, our data has been exposed due to data security breaches at our third party vendors, but to date none of these incidents have had a material impact on our operations or financial results. Any such future events, such as unauthorized access or fraudulent activity with our third party vendors could have a material adverse effect on our business and financial results.
More of our employees are working from their homes or other remote locations than before, which makes it more difficult for us to monitor their activities, the security of their work locations, insider threats, and data exfiltration. This has increased the risk of security incidents, which could include unauthorized access to, disclosure of, or loss of personal and/or confidential data, as well as other types of fraudulent activity. Any such unauthorized access or fraudulent activity could have a material adverse effect on our business and financial results.
The potential risk of security breaches, fraud and cyberattacks may increase as we continue to introduce services and offerings, whether mobile, cloud, or otherwise. Any additional services and offerings inevitably increase the potential for a cyberattack against us. Further, data privacy and cybersecurity are subject to frequently changing laws and regulations, including the European Union’s General Data Protection Regulation (the “GDPR”), the California Privacy Rights Act (the “CPRA”), and additional legislation in place, or expected to become effective, in various U.S. states and other countries. These laws and regulations are increasing in number, complexity, burden and potential financial penalties, and are often inconsistent among the various jurisdictions and countries in which we provide services. For example, the GDPR and the CPRA impose significant compliance obligations that add costs and operational burdens to our business with respect to our collection, use, storage and retention of personal data. Compliance with these obligations could reduce operational efficiency and increase our regulatory compliance costs, and failure to satisfy these requirements may lead to significant regulatory enforcement actions and/or large private litigation in the event of a security breach or other violation. Under the GDPR, the maximum fine can be up to 4% of a company’s global revenue, and there is no maximum penalty under the CPRA. In addition, our liability insurance might not be sufficient in scope or amount to cover us against claims and losses related to violations of data privacy and cybersecurity laws or security breaches, social engineering, cyberattacks and other related data disclosure, loss or breach.
We have outsourced aspects of our business, which could result in disruption, increased costs, and reputational risk.
We have increasingly outsourced, and may further outsource, important processes of our business to third party vendors, which exposes us to other risks, including increased costs, supply chain interruptions, potential disruptions to our business operations, and reputational risk. For example, we rely on third parties to host, manage and secure certain aspects of our data center information and technology infrastructure, to develop and maintain new technology for attracting, onboarding, managing, and analyzing our workforce, and to provide important back-office support. We have increasingly centralized our vendor profile so that we are reliant on a small number of vendors for highly critical corporate and technology functions. While we believe these third-party vendors provide greater efficiency and expertise, our dependence on a small number of vendors increases the risk that our business will be adversely affected if our vendors are unable to provide these services consistent with our needs. Similarly, our business continuity and our margins could be adversely affected if we needed to replace one of our critical vendors for performance or economic reasons.
Our operations also depend significantly upon these vendors’ and our ability to protect our data and to ensure the availability of our servers, software applications and websites. Despite our and our third-party vendors’ implementation of security measures, our systems remain susceptible to system failures, computer viruses, natural disasters, unauthorized access, cyberattacks and other similar incidents, any of which could result in disruptions to our operations. Our vendors have experienced data losses in the past, and we can expect such data incidents will occur in the future. A successful breach of the security of our technology systems, or those of our vendors, could result in the theft of confidential, personally identifiable, or other sensitive data, including data about our employees and/or associates, or our human resources operations, any of which could damage our reputation in the market. If we are not able to realize the savings associated with outsourcing services or if there is a disruption or security breach of our outsourced services that results in a loss or damage to our data, or in an inappropriate disclosure of confidential, personally identifiable, or sensitive data, our business and financial results could be materially adversely affected.
Risks and uncertainties related to the development and use of AI could harm our business operations, reduce demand for our services, and raise legal or regulatory challenges .
Leveraging AI-based technology for our internal operations and service offerings presents risks, costs, and challenges as we begin to implement AI capabilities, including generative AI, to improve our operating efficiency and develop client offerings. If we fail to continue to develop and implement AI-based services and solutions or if those technologies fail to perform as predicted, we may not be able to recover our investment in these technologies and we may fail to realize the potential benefits of AI.
15
Part I |
The rapidly increasing deployment of AI technology by our customers may lead to reduced demand for our services and solutions. As these technologies evolve, some services and tasks currently performed by our associates may be replaced by AI automation, which could lead to reduced demand for our services if we cannot replace such demand with new services.
The development, adoption, and use of AI technologies is still in early stages and could involve significant legal, reputational and financial harm. AI algorithms and training methodologies may be flawed and datasets may be overbroad, insufficient, or contain biased information. Moreover, the use of AI may give rise to risks related to harmful content, accuracy, bias, intellectual property infringement or misappropriation, defamation, data privacy, cybersecurity and health and safety, among others. These risks also bring the possibility of new or enhanced governmental or regulatory scrutiny, litigation or other legal liability, or ethical concerns that could adversely affect our business, reputation, or financial results.
Evolving rules, regulations, and industry standards governing AI may require us to incur significant costs to modify, maintain, or align our business practices, services and solutions to comply with US and non-US rules and regulations, the nature of which cannot be determined at this time and may be inconsistent across jurisdictions. Several jurisdictions where we operate are considering or have enacted legislation and policies regulating AI, such as the European Union’s AI Act. These regulations may impose significant requirements on how we design, build and deploy AI and use AI to make employment decisions on behalf of ourselves or our clients.
A loss or reduction in revenues from large client accounts could have a material adverse effect on our business.
Our client mix consists of both small- and medium-size businesses, which are based upon a local or regional relationship with our presence in each market, and large national and multinational clients. These large national and multinational clients will frequently enter into non-exclusive arrangements with several firms, and the client is generally able to terminate their contract with us on short notice without penalty. The deterioration of the financial condition or business prospects of one or more large national and/or multinational clients, or a change in their strategy around the use of our services, could reduce their need for our services and result in a significant decrease in the revenues and earnings we derive from them. A loss or reduction in revenues from our large national and multinational clients could have a material adverse effect on our business.
If we lose our key personnel, then our business may suffer.
Our operations are dependent on the continued efforts of our officers and executive management and the performance and productivity of headquarters management and staff, our local managers and field personnel. Our ability to attract and retain business is significantly affected by local relationships and the quality of service rendered. If we were to lose key personnel who have acquired significant experience in managing our business or managing companies on a global basis or in key markets, it could have a significant impact on our operations.
Intense competition may limit our ability to attract, train and retain the qualified personnel necessary for us to meet our clients’ staffing needs.
Our business depends on our ability to attract and retain qualified associates who meet the requirements of our clients and possess skill sets and experience that match client needs. In many markets, we have recently experienced an unusually tight labor market, with historically low levels of unemployment, and there is a risk that we may be unable to meet our clients’ requirements in identifying an adequate number of associates. These labor shortages have been exacerbated by employees and potential employees leaving the labor market due to burn-out, resignation, early retirement, immigration challenges, workplace safety concerns, and childcare responsibilities. Workers have also impacted the labor market through increasing demands for change in employment conditions, such as demands for higher wages, remote work, and additional flexibility in work schedule. We must continually evaluate and upgrade our base of available qualified personnel through recruiting and training programs to keep pace with changing client needs and emerging technologies. This is especially acute for individuals with critical IT capabilities and other technology skills that are in high demand by many companies, as competition for such individuals with proven professional skills is intense, and we expect demand for such individuals to remain strong for the foreseeable future. Qualified personnel with relevant skills may not be available to us in sufficient numbers and on terms of employment acceptable to us. Additionally, our clients may look to us for assistance in identifying and integrating into their organizations’ workers from diverse backgrounds, and who may represent different generations, geographical regions, and skillsets. These needs may change due to business requirements, or in response to geopolitical and societal trends. There is a risk that we may not be able to identify workers with skills that match client demand, or that our training programs may not succeed in developing effective or adequate skills. If we fail to recruit, train and retain qualified associates who meet the needs of our clients, our reputation, business and financial results could be materially adversely affected.
16
Part I |
Our global operations subject us to certain risks beyond our control.
With operations in approximately 75 countries and territories around the world, we are subject to numerous risks outside of our control, including risks arising from political unrest and other political events, regional and international hostilities and international responses to these hostilities, strikes and other worker unrest, natural disasters, the impact of global climate change, acts of war, terrorism, international conflict, severe weather conditions, pandemics, and other global health emergencies, disruptions of infrastructure and utilities including energy, cyberattacks, and other events beyond our control.
Although it is not possible to predict such events or their consequences, these events could materially adversely affect our reputation, business and financial results.
Our ability to attract and retain business and employees may depend on our reputation in the marketplace.
We believe our reputation, along with our brand equity in the ManpowerGroup name and our various other brands, are important corporate resources that help distinguish our services from those of competitors and also contribute to our efforts to recruit and retain talented employees. However, our corporate reputation is potentially susceptible to material damage by events such as disputes with clients, information technology security breaches, internal control deficiencies, delivery failures or compliance violations. Similarly, our reputation could be damaged by actions or statements of current or former clients, employees, competitors, vendors, franchisees and other third-party brand licensees, adversaries in legal proceedings, government regulators, as well as members of the investment community or the media. There is a risk that negative information about ManpowerGroup, even if based on rumor or misunderstanding, could materially adversely affect our business. Damage to our reputation could be difficult, expensive and time-consuming to repair, could make potential or existing clients reluctant to select us for new engagements, resulting in a loss of business, and could materially adversely affect our recruitment and retention efforts. Damage to our reputation could also reduce the value and effectiveness of the ManpowerGroup name and our other brand names, and could reduce investor confidence in us, materially adversely affecting our share price.
Changes in sentiment toward the staffing industry could affect the marketplace for our services.
From time to time, the staffing industry has come under criticism from unions, works councils, regulatory agencies and other constituents that maintain that labor and employment protections, such as wage and benefits regulations, are subverted when clients use contingent staffing services. Our business is dependent on the continued acceptance of contingent staffing arrangements as a source of flexible labor for our clients. If attitudes or business practices in some locations change due to pressure from organized labor, political groups or regulatory agencies, it could have a material adverse effect on our business, results of operations and financial condition.
We have only a limited ability to protect our thought leadership and other intellectual property, which is important to our success.
Our success depends, in part, upon our ability to protect our proprietary methodologies and other intellectual property including the value of our brands. Existing laws of the various countries in which we provide services or solutions may offer only limited protection. We rely upon a combination of trade secrets, confidentiality, license and other contractual agreements, and copyright and trademark laws to protect our intellectual property rights. We cannot be certain that the legal steps we are taking around the world are sufficient to protect our intellectual property rights and may not be adequate to prevent or deter infringement or other misappropriation of our intellectual property by competitors, former employees or other third parties. In addition, our intellectual property rights may not prevent competitors from independently developing products, services and solutions similar to ours. Failure to adequately protect our intellectual property rights, or changes in law that diminish or remove our current legal protections could have a material adverse impact on our business and financial results.
In addition, we cannot be sure that our services and solutions do not infringe on the intellectual property rights of third parties, and these third parties could claim that we or our clients are infringing upon their intellectual property rights. These claims could harm our reputation, cause us to incur substantial costs or prevent us from offering some services or solutions in the future.
17
Part I |
Strategic Risks
We may be unable to effectively implement our business strategy, and there can be no assurance that we will achieve our objectives.
Our business strategy focuses on growing revenues while improving our operating profits. An important element of our strategy is our effort to diversify our revenues beyond our core staffing and employment services. This includes expanding our sales in higher margin professional resourcing, such as our Experis brand in IT recruitment. There is a risk that our growth strategy in Experis may be impeded due to the scarcity of talent in the IT field, which is particularly in demand, and which may restrict our ability to fulfill customer requirements. Similarly, another aspect of our strategy to expand beyond our core staffing and employment services is through the sale of innovative workforce solutions designed to achieve higher operating margins. Our higher-margin Right Management career management services have historically performed well in periods of downturn, and it is part of our business strategy that this counter-cyclical effect would help cushion our results in the event of a period of decline. However, in the event of a downturn, there can be no assurances that the margin contribution from Right Management would increase, or that it would significantly offset other declines we might experience in the business. Additionally, our workforce solutions are often unique, non-repeatable and tailored to a client’s needs, and present costs, risks and complexity that may be difficult to calculate. These solutions may be unprofitable if we are not able to accurately anticipate these costs and risks in our pricing for these solutions. For example, we may fail to structure and price our solutions in a manner that properly compensates us to create an adequate delivery model, to adequately manage new solutions, or to obtain adequate insurance coverage in amount or scope to cover potential risks arising from such solutions.
Our business strategy also includes continuing efforts to transform how we use personnel and technology to manage our financial administration and to enhance our delivery of services. For example, in 2024 we continued to progress in our deployment of PowerSuite, our global cloud-based platforms for front and back office. In addition, during 2024, we opened our Global Business Services center in Porto, Portugal, our regional finance center to serve all of Europe and a central component of our global strategy to standardize, centralize and transform finance service delivery.
These projects are complex and may consume considerable financial and personnel resources. The goal of these transformation initiatives is to become a more agile and effective competitor, to reduce the cost of operating our business and to increase our operating profit and operating profit margin. However, as these efforts may consume considerable resources, they may put pressure on our operating results or ability to address other priorities. They may not be successful, may not be achieved within our timing and cost estimates, and may not ultimately reduce our operating costs or prevent the return of any costs that are eliminated. Additionally, reductions in personnel and other changes emerging from these projects could materially adversely affect our ability to effectively operate our business. If, for these or other reasons, we are not successful in implementing our business strategy or achieving the anticipated results of our transformation initiatives, our business, financial condition, results of operations, and internal control over financial reporting could be materially adversely affected.
Our results of operations and ability to grow could be materially negatively affected if we cannot successfully keep pace with technological changes in the development and implementation of our services and solutions.
Our success depends on our ability to keep pace with rapid technological changes in the development and implementation of our services and solutions. For example, rapid changes in the functionality and potential uses of AI, machine learning and robotics are having a significant impact on some of the industries we serve. This technological disruption could also have significant and unforeseen consequences for the workforce services industry and for our business in particular, such as a reduced demand for our services or challenges to effective implementation of this technology. There is a risk that these, or other developments, could result in significant rapid disruption to our business model, and that we will be unprepared to compete effectively. This challenge is further complicated by rapidly evolving regulatory restrictions governing the permitted uses of artificial intelligence.
Additionally, our business is reliant on a variety of technologies, including those which support applicant on-boarding and tracking systems, order management, billing, payroll, and client data analytics. There is a risk we will not sufficiently invest in technology or industry developments, or evolve our business with the right strategic investments, or at sufficient speed and scale, to adapt to changes in our marketplace. Similarly, from time to time we make strategic commitments to particular technologies to recruit, manage or analyze our workforce or support our business, and there is a risk they will be unsuccessful. Additionally, there are risks and uncertainties associated with our use of, and client demand for, AI technologies which could expose us to regulatory, legal, reputational or financial harm. These and similar risks could have a negative effect on our services and solutions, our results of operations, and our ability to develop and maintain a competitive advantage in the marketplace.
18
Part I |
Our sustainability commitments and disclosures may expose us to risks, legal liability, and increased costs.
Our business could be impacted in several ways by our corporate sustainability initiatives, including our goals for sustainability, diversity, and inclusion.
Our acquisition strategy may be unsuccessful and may introduce unexpected costs.
From time to time, we make acquisitions of other companies or operating assets. These activities involve significant strategic and operational risks, including:
19
Part I |
These risks could have a material adverse effect on our business because they may result in substantial costs to us and disrupt our business. The integration of prior acquisitions, as well as entry into future acquisition transactions, could materially adversely affect our business, financial condition, results of operations and liquidity. Additionally, we have incurred, and may in the future incur impairment losses on goodwill and other intangible assets with an indefinite life or restructuring charges as a result of acquisitions we make.
From time to time, we undertake dispositions via sales, franchises, joint ventures or other exit activities, and we may face risks related to such transactions.
Occasionally, we dispose of parts of our operations based on risk considerations and to optimize our global strategic and geographic footprint and overall efficiency. We have engaged in such dispositions in the past, including the dispositions of our businesses in Korea and Austria in 2024, the Philippines in 2023 and Russia and Hungary in 2022, respectively. We expect that we will continue to dispose of portions of our business that are not meeting our performance or strategic objectives. Among other alternatives, this could take the form of a closure of a business, the contribution of the business to a joint venture, or an exit by means of a sale to, or a franchise arrangement with, a third party. There are risks and costs associated with any exit activities, which could include difficulties in the separation of operations, services or personnel, the diversion of management attention, and the disruption of our business. Any such transactions may require regulatory or governmental approvals, which could impede the transaction. Divestitures may also involve continued financial involvement in, or liability with respect to, the divested businesses. As a result of divestiture transactions, we could incur severance charges for personnel and payments for lease and other commitments, charges from the impairment or write-off of assets, and other financial loss due to the transaction. Furthermore, there is the risk that we might lose customers, in particular multinational clients with operations in the exited countries or operations. Additionally, if we choose to enter into a franchise arrangement for a third party to operate our business in the exited region using our trademarks and other licensed assets, we face potential counterparty and reputational risks arising from the franchisee’s operation of the business. The reputational risks include the risk that marketplace participants, including clients, candidates and the media, may believe that we continue to control the operations of a divested or franchised business that operates utilizing our name or other trademarks.
Financial and Market Risks
Foreign currency fluctuations may have a material adverse effect on our operating results.
Although we report our results of operations in United States dollars, the majority of our revenues and expenses are denominated in currencies other than the United States dollar, and unfavorable fluctuations in foreign currency exchange rates could have a material adverse effect on our reported financial results. Highly inflationary economies of foreign countries can result in foreign currency devaluation, which may also negatively impact our reported financial results. This occurred in Argentina and is likely to continue while the country attempts to stabilize its currency exchange rate going forward.
During 2024, approximately 85% of our revenues were generated outside of the United States, the majority of which were generated in Europe. Furthermore, $952.8 million of our outstanding indebtedness as of December 31, 2024 was denominated in foreign currencies, including $928.4 million related to our Euro-denominated notes (€900.0 million). Increases or decreases in the value of the United States dollar against other major currencies, or the imposition of limitations on conversion of foreign currencies into United States dollars, could affect our revenues, operating profit and the value of balance sheet items denominated in foreign currencies. Our exposure to foreign currencies, in particular the Euro, could have a material adverse effect on our reported results and shareholders’ equity, however, such fluctuations generally do not affect our cash flow or result in actual economic gains or losses unless we repatriate funds. Furthermore, the volatility of currencies may make year-over-year comparability of our financial results difficult.
20
Part I |
We seek to mitigate our exposure to foreign currency fluctuations by utilizing net investment hedges and, from time to time, foreign currency forward exchange contracts and cross-currency swaps. Our Euro-denominated notes are designated as a hedge of our net investment in subsidiaries with a Euro-functional currency as of December 31, 2024, to mitigate our Euro currency translation exposure. The effectiveness of this hedge in part depends on our ability to accurately forecast future cash flows, which is particularly difficult during periods of uncertain or uneven demand for our services and highly volatile exchange rates. Further, hedging activities may only offset a portion, or none at all, of the material adverse financial effects of unfavorable fluctuations in foreign exchange rates over the time the hedge is in place or effective.
Our liquidity could be adversely impacted by economic conditions affecting our clients.
Our working capital is primarily in the form of trade receivables which generally increase as sales increase. One of the ways in which we measure our working capital is in terms of working capital as a percent of revenue with a focus on Days Sales Outstanding (“DSO”). During periods of decline or uncertainty, our clients may slow the rate at which they pay their vendors, or they may become unable to pay their obligations. In addition, some clients have begun to impose more challenging billing terms, which increases the length of time before we receive payment for services. If our clients become unable to pay amounts owed to us, or pay us more slowly, then our DSO will increase, and our cash flow, liquidity, and profitability may suffer.
Our results of operations and share price could be materially adversely affected if we are unable to maintain effective internal controls.
The accuracy of our financial reporting is dependent on the effectiveness of our internal controls. We are required to provide a report from management to our shareholders on our internal control over financial reporting that includes an assessment of the effectiveness of these controls. Internal control over financial reporting has inherent limitations, including human error, the possibility that controls could be circumvented or become inadequate because of changed conditions, and fraud. Because of these inherent limitations, internal control over financial reporting might not prevent or detect all misstatements or fraud. If we cannot maintain and execute adequate internal control over financial reporting or implement required new or improved controls that provide reasonable assurance of the reliability of the financial reporting and preparation of our financial statements for external use, we could suffer harm to our reputation, fail to meet our public reporting requirements timely, be unable to properly report on our business and our results of operations, or be required to restate our financial statements. If any of these were to occur, the market price of our securities and our ability to obtain new business could be materially adversely affected.
Our debt levels could materially adversely affect our operating flexibility and put us at a competitive disadvantage.
As of December 31, 2024, we had $952.8 million of total debt. Our level of debt and the limitations imposed on us by our credit agreements could have important consequences for investors, including the following:
Our failure to comply with restrictive covenants under our revolving credit facilities and other debt instruments could trigger prepayment obligations.
Our failure to comply with the restrictive covenants under our revolving credit facilities and other debt instruments could result in an event of default, which, if not cured or waived, could result in us being required to repay these borrowings before their due date. If we are forced to refinance these borrowings on less favorable terms, our results of operations and financial condition could be materially adversely affected by increased costs and rates.
The lenders under our and our subsidiaries’ credit facilities may be unwilling or unable to extend credit to us on acceptable terms or at all.
If our liquidity needs increase, we would expect to use our revolving credit facility, which is provided by a syndicate of banks. Each bank in the syndicate is responsible on a several, but not joint, basis for providing a portion of the loans under the facility. If any of the participants in the syndicate fails to satisfy its obligations to extend credit under the facility, the other participants refuse or are unable to assume its obligations and we are unable to find an alternative source of funding at comparable rates, our liquidity may be materially adversely affected, or our interest expense may increase substantially.
21
Part I |
Furthermore, a number of our subsidiaries maintain uncommitted lines of credit with various banks. Under the terms of these lines of credit, the bank is not obligated to make loans to the subsidiary or to make loans to the subsidiary at a particular interest rate. If any of these banks cancel these lines of credit or otherwise refuse to extend credit on acceptable terms, we may need to extend credit to those subsidiaries, or the liquidity of our subsidiaries may be materially adversely affected.
The performance of our subsidiaries and their ability to distribute cash to our parent company may vary, negatively affecting our ability to service our debt at the parent company level or in other subsidiaries.
Since we conduct a significant portion of our operations through our subsidiaries, our cash flow and our consequent ability to service our debt depends in part upon the earnings of our subsidiaries and the distribution of those earnings to our parent company, or upon loans or other payments of funds by those subsidiaries to our parent company or to other subsidiaries. The payment of such dividends and the making of such loans and advances by our subsidiaries may be subject to legal or contractual restrictions, depend upon the earnings of those subsidiaries and working capital requirements, and be subject to various business considerations, including the ability of such subsidiaries to pay such dividends or make such loans and advances.
Our inability to secure guarantees or letters of credit on acceptable terms may substantially increase our cost of doing business in various countries.
In a number of countries and territories in which we conduct business, we are obligated to provide guarantees or letters of credit to secure licenses, lease space or for insurance coverage. We typically receive these guarantees and letters of credit from a number of financial institutions around the world. In the event that we are unable to secure these arrangements from a bank, lender or other third party on acceptable terms, our liquidity may be materially adversely affected, there could be a disruption to our business or there could be a substantial increase in cost for our business.
We could be subject to changes in tax rates, adoption of new United States or international tax legislation or tax audits that could result in additional income tax liabilities.
We are subject to income and other taxes in the United States and international jurisdictions where we have operations. The tax bases and rates of these respective tax jurisdictions change from time to time due to economic and political conditions. Our effective income tax rate is affected by changes in earnings in countries with differing tax rates, changes in valuation of deferred tax assets and liabilities or changes in the respective tax laws. Our other taxes are impacted by changes in local tax laws or changes in our business.
In addition, tax accounting involves complex matters and requires our judgment to determine our worldwide provision for income and other taxes and tax assets and liabilities. These complex matters include transfer pricing and reporting related to intercompany transactions. We are routinely subject to tax examinations by the United States Internal Revenue Service and other tax authorities. Tax authorities have disagreed, and may disagree in the future, with our judgments. Many taxing authorities are taking increasingly aggressive positions opposing the judgments we make, including with respect to our intercompany transactions. We regularly assess the likely outcomes of our audits and tax proceedings to determine the appropriateness of our tax liabilities. However, our judgments might not be sustained as a result of these audits and tax proceedings, and the amounts ultimately paid could be materially different from the amounts previously recorded.
In addition, changes in tax laws, treaties or regulations, or their interpretation or enforcement, have become more unpredictable and may become more stringent, which could materially adversely affect our tax position. A number of countries where we do business, including the United States and many countries in the European Union, have implemented, and are considering implementing, changes in relevant tax, accounting and other laws, regulations and interpretations. The overall tax environment has made it increasingly challenging for multinational corporations to operate with certainty about taxation in many jurisdictions. For example, a number of members of the Organization for Economic Co-operation and Development have agreed to enact the Pillar Two international tax reform, which introduces a global minimum effective tax rate whereby certain multinational groups are subject to a 15% minimum tax on income derived in low-tax jurisdictions. These rules became effective in some countries in 2024. As another example, in February 2025 the French government enacted legislation resulting in a one-year temporary increase in the corporate income tax rate for our French business from 25.825% to 36.125% for 2025 and a three-year delay to the scheduled phase-out of the French business tax (CVAE). We estimate this legislation will increase our consolidated global effective tax rate in the range of 4% to 5% based on current projections. These proposed and enacted changes in tax laws, treaties or regulations, or their interpretation or enforcement, could have a material adverse impact on our current or future tax positions.
22
Part I |
The price of our common stock may fluctuate significantly, which may result in losses for investors.
The market price for our common stock may be subject to significant volatility. For example, during 2024, the price of our common stock as reported on the New York Stock Exchange ranged from a high of $79.12 to a low of $56.82. Our stock price can fluctuate as a result of a variety of factors, including factors listed in these “Risk Factors” and others, many of which are beyond our control. These factors include:
Regulatory and Legal Risks
Our performance on contracts may be materially adversely affected if we or third parties fail to deliver on commitments.
Our contracts are increasingly complex and, in most instances, require that we partner with other parties or subcontractors to provide the workforce solutions required by our clients. Our clients have become more sophisticated in their contractual negotiation process and more detailed in defining their operational requirements, including requirements to use the client's form of agreement. Our ability to deliver these solutions and provide the services required by our clients is dependent on our and our partners’ ability to meet our clients’ delivery requirements and schedules. If we or our partners fail to deliver services on time and in accordance with contractual performance obligations, then our ability to successfully complete our contracts may be affected, which may have a material and adverse impact on our client relations, revenues and profitability. Additionally, we may incur liability for the actions or omissions of our partners, subcontractors or vendors and we may face challenges or be unable to enforce these obligations against those partners.
Government regulations may result in prohibition or restriction of certain types of employment services or the imposition of additional licensing or tax requirements that may reduce our future earnings.
In many jurisdictions in which we operate, such as France, Italy, Germany, Japan and Mexico, the employment services industry is heavily regulated and scrutinized. For example, in 2021, legislation was adopted in Mexico that affects many types of temporary placements under the country’s labor laws. The law broadly prohibits the provision of our traditional temporary staffing services, only allowing outsourced worker assignments for special, deliverables-based projects outside of the client’s core business activity. This has had a material adverse impact on our business in Mexico. In Europe, governmental regulations in Germany restrict the length of contracts and the industries in which our associates may be used. In some countries, special taxes, fees or costs are imposed in connection with the use of our associates. Additionally, in some countries, trade unions have used the political process to target our industry in an effort to increase the regulatory burden and expense associated with offering or utilizing contingent workforce solutions. Moreover, many countries, including the Netherlands and Japan, have established regulations that require equal-pay for equal-work for temporary workers and fixed term employees. Furthermore, some countries are adopting more restrictive immigration regulations, which may lead to greater expense or inability to fulfill client demand, particularly in our cross-border Talent Solutions business. All of these continuously-evolving regulations could have a significant impact on our revenues, costs, and operating margins.
The countries and territories in which we operate may, among other things:
23
Part I |
Other types of future regulation may have a material adverse effect on our business and financial results by making it more difficult or expensive for us to continue to cost-effectively provide employment services, particularly if we cannot pass along increases in costs to our clients.
Failure to comply with antibribery and corruption laws could materially adversely affect our business.
We are additionally subject to numerous legal and regulatory requirements that prohibit bribery and corrupt acts. These include the Foreign Corrupt Practices Act and the UK Bribery Act 2010, as well as similar legislation in many of the countries and territories in which we operate. Our employees (but not our temporary associates) are required to participate in a global anticorruption compliance training program designed to ensure compliance with these laws and regulations. However, there are no assurances this program will be effective. In many countries where we operate, practices in the local business community may not conform to international business standards and could violate anticorruption law or regulations. Furthermore, we remain subject to the risk that one of our employees (or one of our associates on a temporary or contract-based assignment) could engage in business practices that are prohibited by our policies and these laws and regulations. Any such violations could materially adversely affect our business.
We may be exposed to legal claims, including employment-related claims that could materially adversely affect our business, financial condition and results of operations.
We are subject to a wide variety of potential litigation and other legal claims that arise in the ordinary course of our business. The results of litigation and other legal proceedings are inherently uncertain, and adverse judgments or settlements in some, or all of these legal disputes may result in materially adverse monetary damages, fines, penalties or injunctive relief against us.
For example, through our direct interaction with our clients’ businesses and facilities, including functions and systems that are sensitive or critical to their core businesses, we may be exposed to operational, regulatory, reputational and other risks specific to their business, including data security risks. These risks may be reduced through contractual provisions that limit damages or mitigate our responsibility for losses caused by our assigned workers; but these types of contractual protections are not always possible because we may perceive an important economic opportunity, because of the contracting practices of our industry competitors or because our personnel did not adequately follow our contracting guidelines. In addition, as we expand our services and solutions into new areas, we may be exposed to additional and evolving risks specific to these new areas.
We are in the business of employing people and placing them in the workplaces of other businesses. Risks relating to these activities could include possible claims of or relating to:
24
Part I |
We may incur fines and other losses or negative publicity with respect to the above risks. In addition, some or all of these claims may give rise to litigation, which could be time-consuming to our management team and costly and could have a negative impact on our business regardless of the merits of the claim. For example, in the past, we have devoted considerable time and expense to resolve several California-based “wage and hour” claims that asserted deficiencies in our payroll practices, and we are often sued by plaintiffs in various other employment-related matters, including those seeking class action status in the US. It is likely we will continue to experience similar claims in the future, which may increase in number as a result of remote working assignments as well as increasing employment regulation at the state and local level.
We cannot be certain our insurance will be sufficient in amount or scope to cover all claims that may be asserted against us. Should the ultimate judgments or settlements exceed our insurance coverage, they could have a material effect on our results of operations, financial position and cash flows. We cannot be certain we will be able to obtain appropriate types or levels of insurance in the future, that adequate replacement policies will be available on acceptable terms, if at all, or that the companies from which we have obtained insurance will be able to pay claims we make under such policies.
Our business exposes us to competition law risk.
We are subject to antitrust and competition law in the United States, the European Union, and many other regions in which we operate. Some of our business models may carry a heightened risk of regulatory inquiry under relevant competition laws. Although we have put in place safeguards designed to maintain compliance with applicable competition laws, there can be no assurance these protections will be adequate. Competition law authorities have investigated our business practices in the past in France and in other countries, and there continues to be a risk of such inquiries in the future. There is no assurance we would successfully defend against any such regulatory inquiries, and they could consume substantial amounts of our financial and managerial resources, remain outstanding for a significant duration, and result in adverse publicity, even if successfully resolved. An unfavorable outcome could result in liabilities that have a material adverse effect upon our business, financial condition or results of operations.
Wisconsin law and our articles of incorporation and bylaws contain provisions that could make the takeover of our company more difficult.
Certain provisions of Wisconsin law and our articles of incorporation and bylaws could have the effect of delaying or preventing a third party from acquiring us, even if a change in control would be beneficial to our shareholders. These provisions of our articles of incorporation and bylaws currently include:
In addition, the Wisconsin control share acquisition statute and Wisconsin’s “fair price” and “business combination” provisions, in addition to other provisions of Wisconsin law, limit the ability of an acquiring person to engage in certain transactions or to exercise the full voting power of acquired shares under certain circumstances. As a result, offers to acquire us, which may represent a premium over the available market price of our common stock, may be withdrawn or otherwise fail to be realized. The provisions described above could cause our stock price to decline.
Item 1B. Unresolved Staff Comments
Not applicable.
25
Part I |
Item 1C. Cybersecurity
We have an enterprise-wide information security program designed to identify, protect, detect, and respond to and manage reasonably foreseeable cybersecurity risks and threats. To protect our information systems from cybersecurity threats, we use various security tools that help prevent, detect, escalate, investigate, and remediate identified risks and security incidents in a timely manner.
We regularly assess risks from cybersecurity and technology threats and monitor our information systems for potential vulnerabilities. We use a widely adopted risk quantification model to identify, measure and prioritize cybersecurity and technology risks and develop related security controls and safeguards. We conduct regular reviews and tests of our information security controls and leverage audits by our internal audit team, tabletop exercises, penetration and vulnerability testing, red team exercises, and other exercises to evaluate the effectiveness of our information security program and improve our security measures and planning.
Our systems periodically experience directed attacks intended to lead to interruptions and delays in our operations and the services we provide to clients as well as loss, misuse or theft of personal information (candidates, associates, vendors, clients and employees) and other data, confidential information or intellectual property, and we have experienced data exposures in the past.
The Audit Committee of the Board of Directors oversees our annual enterprise risk assessment, where we assess key risks within the company, including security and technology risks and cybersecurity threats.
Item 2. Properties
We own properties at various locations worldwide, none of which are material. Most of our operations are conducted from leased premises and we do not anticipate any difficulty in renewing these leases or in finding alternative sites in the ordinary course of business.
Item 3. Legal Proceedings
We are involved in litigation of a routine nature and various legal matters, which are being defended and handled in the ordinary course of business.
Item 4. Mine Safety Disclosures
Not applicable.
26
Part I |
INFORMATION ABOUT OUR EXECUTIVE OFFICERS
(as of February 19, 2025)
Name of Officer |
|
Office |
|
|
|
Jonas Prising Age 60 |
|
Chairman of ManpowerGroup since December 2015. Chief Executive Officer of ManpowerGroup since May 2014. ManpowerGroup President from November 2012 to May 2014. Executive Vice President, President of ManpowerGroup - the Americas from January 2009 to October 2012. Executive Vice President, President – United States and Canadian Operations from January 2006 to December 2008. A director of ManpowerGroup since May 2014. An employee of ManpowerGroup since May 1999. A director of Kohl's Corporation since August 2015. |
|
|
|
John T. McGinnis Age 58 |
|
Executive Vice President, Chief Financial Officer of ManpowerGroup since February 2016. Global Controller of Morgan Stanley from January 2014 to February 2016. Chief Financial Officer, HSBC North America from July 2012 to January 2014. Chief Financial Officer, HSBC Bank USA from July 2010 to January 2014. An employee of ManpowerGroup since February 2016. |
|
|
|
Becky Frankiewicz Age 53 |
|
Regional President, North America and Chief Commercial Officer since June 2022. Regional President, North America from July 2017 to June 2022. General Manager Quaker Foods North America at PepsiCo from October 2014 to July 2017. An employee of ManpowerGroup since July 2017. A director of Energizer Holdings, Inc. since January 2020. |
|
|
|
Michelle S. Nettles Age 53 |
|
Executive Vice President, Chief People and Legal Officer since January 2025. Executive Vice President, Chief People and Culture Officer from May 2022 to December 2024. Senior Vice President, Chief People and Culture Office from July 2019 to May 2022. Chief People and Diversity Officer of Molson Coors Brewing Company from October 2016 to July 2019. Chief Human Resources Officer of MillerCoors from October 2014 to October 2016. Prior thereto, held other positions at MillerCoors since 2009. An employee of ManpowerGroup since July 2019. A director of RXO, Inc. since November 2022. |
27
Part I |
OTHER INFORMATION
Audit Committee Approval of Audit-Related and Non-Audit Services
The Audit Committee of our Board of Directors has approved the following audit-related and non-audit services performed or to be performed for us by our independent registered public accounting firm, Deloitte & Touche LLP and Affiliates, in 2024:
28
Part II |
PART II
Item 5. Market for Registrant’s Common Equity, Related Shareholder Matters and Issuer Purchases of Equity Securities
Common Stock Listing and Trading
The Company's common stock is listed for trading on the New York Stock Exchange under the symbol MAN.
Shareholders of Record
As of February 17, 2025, the Company's common stock was held by approximately 2,500 record holders.
Dividend Policy
While we currently expect that future semi-annual dividends will continue to be paid, our dividend policy is subject to review and change at the discretion of our Board of Directors and may depend upon, among other factors, earnings, financial condition, and other requirements.
Issuer Purchases of Equity Securities
In August 2023, the Board of Directors authorized the repurchase of 5.0 million shares of our common stock. We conduct share repurchases from time to time through a variety of methods, including open market purchases, block transactions, privately negotiated transactions or similar facilities. The following table shows the total number of shares repurchased during the fourth quarter of 2024. As of December 31, 2024, there were 2.6 million shares remaining authorized for repurchase under the 2023 authorization.
|
|
Total number of |
|
|
Average |
|
|
Total number of |
|
|
Maximum number |
|
||||
|
|
|
|
|
|
|
|
|
|
|
|
|
||||
October 1 - 31, 2024 |
|
|
254,386 |
|
(a) |
$ |
63.09 |
|
|
|
253,605 |
|
|
|
2,893,160 |
|
|
|
|
|
2 |
|
|
|
|
|
|
|
|
||||
November 1 - 30, 2024 |
|
|
142,747 |
|
(b) |
|
63.56 |
|
|
|
141,602 |
|
|
|
2,751,558 |
|
December 1 - 31, 2024 |
|
|
156,631 |
|
|
|
57.46 |
|
|
|
156,631 |
|
|
|
2,594,927 |
|
Total |
|
|
553,764 |
|
|
$ |
61.61 |
|
|
|
551,838 |
|
|
|
2,594,927 |
|
29
Part II |
Performance Graph
Set forth below is a graph for the periods ending December 31, 2019-2024 comparing the cumulative total shareholder return on our common stock with the cumulative total return of companies in the Standard & Poor’s 400 Midcap Stock Index and the Standard & Poor’s 1500 Human Resources and Employment Services Sub-Industry Index. We are included in the Standard & Poor’s 1500 Human Resources and Employment Services Sub-Industry Index and we estimate that we constituted 1% of the total market capitalization of the companies included in the index. The graph assumes a $100 investment on December 31, 2019 in our common stock, the Standard & Poor’s 400 Midcap Stock Index and the Standard & Poor’s 1500 Human Resources and Employment Services Sub-Industry Index and assumes the reinvestment of all dividends.
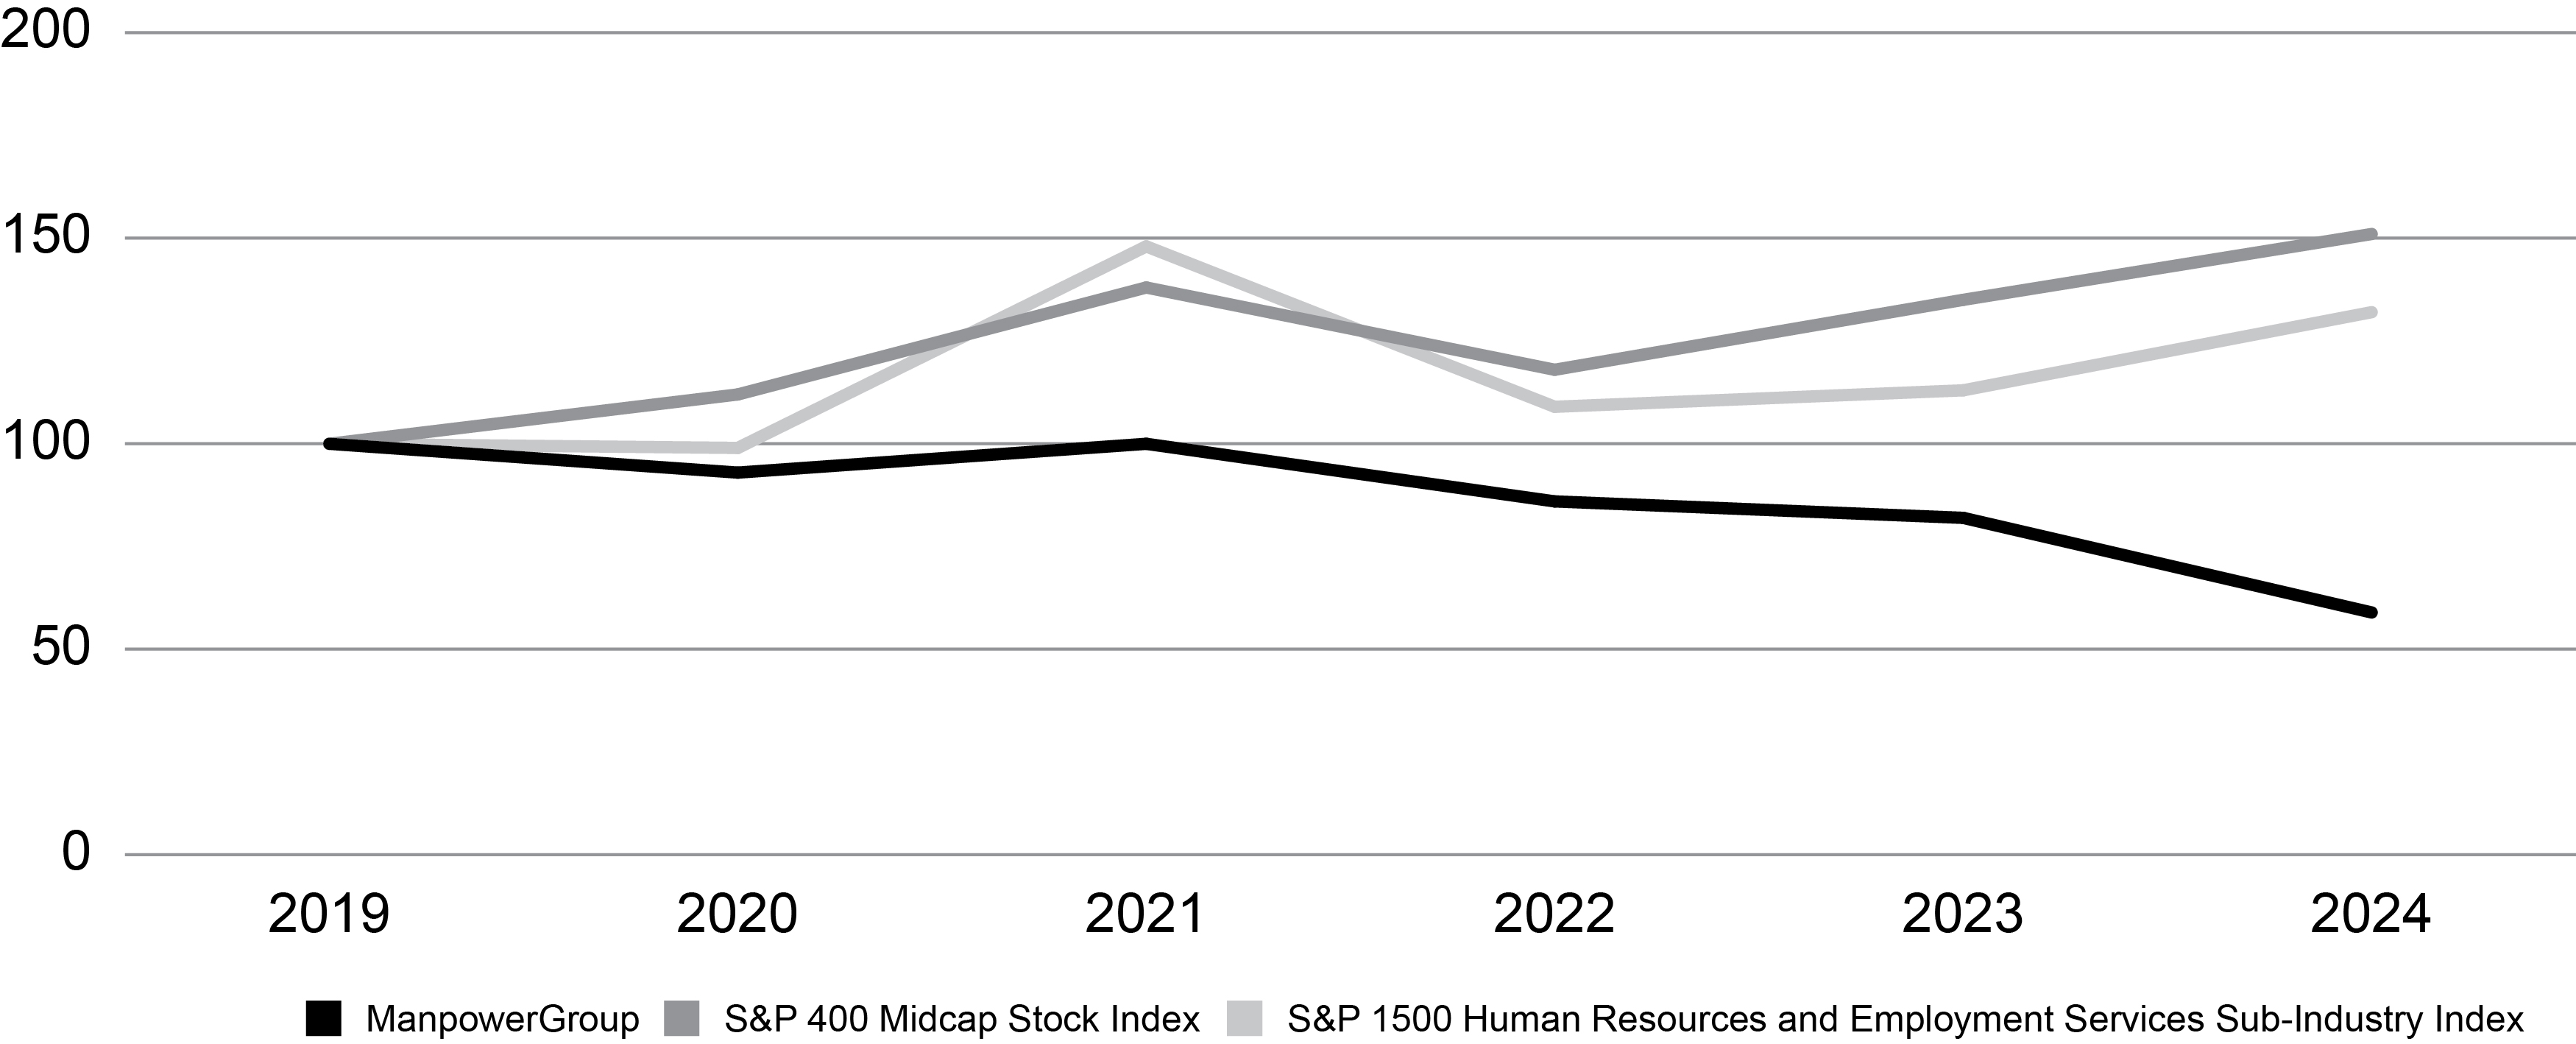
December 31 |
|
2019 |
|
|
2020 |
|
|
2021 |
|
|
2022 |
|
|
2023 |
|
|
2024 |
|
||||||
|
|
|
|
|
|
|
|
|
|
|
|
|
|
|
|
|
|
|
||||||
ManpowerGroup |
|
$ |
100 |
|
|
$ |
93 |
|
|
$ |
100 |
|
|
$ |
86 |
|
|
$ |
82 |
|
|
$ |
59 |
|
S&P 400 Midcap Stock Index |
|
|
100 |
|
|
|
112 |
|
|
|
138 |
|
|
|
118 |
|
|
|
135 |
|
|
|
151 |
|
S&P 1500 Human Resources and Employment Services Sub-Industry |
|
|
100 |
|
|
|
99 |
|
|
|
148 |
|
|
|
109 |
|
|
|
113 |
|
|
|
132 |
|
Item 6. [Reserved]
30
Part II |
7. Management’s Discussion and Analysis of Financial Condition and Results of Operations
in millions, except share and per share data
Financial Measures — Constant Currency And Organic Constant Currency
Changes in our financial results include the impact of changes in foreign currency exchange rates, acquisitions and dispositions. We provide “constant currency” and “organic constant currency” calculations in this report to remove the impact of these items. We express year-over-year variances that are calculated in constant currency and organic constant currency as a percentage.
When we use the term “constant currency,” it means that we have translated financial data for a period into United States dollars using the same foreign currency exchange rates that we used to translate financial data for the previous period. We believe that this calculation is a useful measure, indicating the actual growth of our operations. We use constant currency results in our analysis of subsidiary or segment performance, including Argentina which operates in a hyperinflationary economy. We also use constant currency when analyzing our performance against that of our competitors. Substantially all of our subsidiaries derive revenues and incur expenses within a single country and, consequently, do not generally incur currency risks in connection with the conduct of their normal business operations. Changes in foreign currency exchange rates primarily impact reported earnings and not our actual cash flow unless earnings are repatriated.
When we use the term “organic constant currency,” it means that we have further removed the impact of acquisitions in the current period and dispositions from the prior period from our constant currency calculation. We believe that this calculation is useful because it allows us to show the actual growth of our ongoing business.
The constant currency and organic constant currency financial measures are used to supplement those measures that are in accordance with United States Generally Accepted Accounting Principles (“GAAP”). These Non-GAAP financial measures may not provide information that is directly comparable to that provided by other companies in our industry, as other companies may calculate such financial results differently. These Non-GAAP financial measures are not measurements of financial performance under GAAP, and should not be considered as alternatives to measures presented in accordance with GAAP.
Constant currency and organic constant currency percent variances, along with a reconciliation of these amounts to certain of our reported results, are included in the Financial Measures section found in Item 7. "Management's Discussion and Analysis of Financial Condition and Results of Operations."
Results of Operations - For Years of Operation Ending December 31, 2024 and 2023
The financial discussion that follows focuses on 2024 results compared to 2023. For a discussion of 2023 results compared to 2022, see the company’s Annual Report on Form 10-K for the year ended December 31, 2023.
During 2024, revenues decreased -5.6% compared to 2023. Our 2024 results reflected the negative impact of economic uncertainty, particularly in Europe and North America, as we saw decreased demand for our staffing and permanent recruitment services, partially offset by increased demand for our Right Management outplacement services as well as increased demand in Asia Pacific and Latin America. As Europe represents a significant portion of our operations, we continue to monitor economic conditions in our Southern Europe and Northern Europe segments. Inflation has eased in Europe and the United States resulting in both markets reducing interest rates during the year. However, employers are continuing their cautious approach with many employers retaining their current workforce, delaying hiring decisions or reducing their demand for contingent labor as they remain focused on managing the macro-economic and geopolitical challenges impacting their businesses. Many employers are still hesitant to increase their spend and expand their workforce until they perceive a significant improvement in economic outlook. As a result of these factors, we expect the business environment will continue to be challenging, which could further negatively impact our operations in future periods.
During 2024, the United States dollar strengthened, on average, relative to the currencies in most of our markets, and overall had an unfavorable impact on our reported results. The changes in the foreign currency exchange rates had a -2.2% unfavorable impact on revenues from services and an approximately $0.15 per share unfavorable impact on net earnings per share – diluted in 2024. Substantially all of our subsidiaries derive revenues from services and incur expenses within the same local currency and generally do not have cross-currency transactions, and therefore, changes in foreign currency exchange rates primarily impact reported earnings and not our actual cash flow unless earnings are repatriated. To understand the performance of our underlying business, we utilize constant currency or organic constant currency variances for our consolidated and segment results.
31
Part II |
During 2024, we experienced the following quarterly changes to our consolidated revenues compared to 2023: a -7.3% decrease in revenue in the first quarter due to softening demand for staffing services due to increased economic uncertainty, partially offset by an increase in demand for our Right Management outplacement services; a revenue decrease of -6.9% in the second quarter due to the continued softening demand for staffing and permanent recruitment services; a revenue decrease of -3.1% in the third quarter due to the continued softening demand for staffing services, partially offset by an increase in demand for our Right Management outplacement services; and ending the year with a -5.0% revenue decrease in the fourth quarter of 2024 due to the continuing decrease in demand for our staffing services.
During 2024 compared to 2023, most of our markets experienced revenue decreases due to softening demand for our staffing and permanent recruitment services and the strengthening of the dollar in certain markets, partially offset by increased demand for our Right Management outplacement services. We experienced a -4.3% revenue decrease in the Americas primarily driven by the unfavorable impact of currency exchange rates and a decrease in demand for our Experis interim services, partially offset by an increase in demand for our Manpower staffing services, an increase in demand for our Talent Based Outsourcing (TBO) business and an increase in demand for our Right Management outplacement services. We experienced a -3.5% revenue decrease in Southern Europe, primarily driven by a decrease in demand for our Manpower and Experis staffing/interim services and a decrease in demand for our permanent recruitment services, partially offset by an increase in demand for our Right Management outplacement services. We experienced a revenue decrease of -11.8% in Northern Europe, primarily due to decreased demand in our Manpower and Experis staffing/interim services, decreased demand in our permanent recruitment business and decreased demand for our Experis solutions services, partially offset by increased demand in our TAPFIN - Managed Service Provider (MSP) business and increased demand for our Right Management outplacement services. We experienced a -6.9% revenue decrease in APME, primarily driven by the unfavorable impact of currency exchange rates, decreased demand in our permanent recruitment business and a decrease in demand in our TBO business, partially offset by an increase in demand for our Manpower and Experis staffing/interim services.
From a brand perspective, we experienced a revenue decrease in Manpower, Experis and Talent Solutions during 2024 compared to 2023. The revenue decrease in our Manpower brand was due to decreased demand for our staffing services and the unfavorable impact of currency exchange rates. In our Experis brand, the revenue decrease was primarily due to decreased demand for our interim services and decreased demand for our Experis solutions services. The revenue decrease in our Talent Solutions brand, which includes Recruitment Process Outsourcing (RPO), TAPFIN - MSP, and our Right Management offerings, was driven primarily by decreased activity in our RPO permanent recruitment business, partially offset by increased demand for our Right Management outplacement services and increased demand in our MSP business.
In 2024 our gross profit margin decreased 50 basis points compared to 2023 primarily due to decreases in our permanent recruitment business, including Talent Solutions RPO, as permanent hiring demand continued to soften and experienced reduced levels from the prior year period and a decrease in staffing/interim margins due to mix shifts and lower volumes while pricing remained stable. The decrease was partially offset by increased career transition activity in Right Management as outplacement activity increased.
In 2024 our operating profit increased 19.6% while our operating profit margin increased 30 basis points compared to 2023. The operating profit margin increased primarily due to a reduction in selling and administrative expenses, including wind down charges related to our Germany Proservia business and goodwill impairment charges in 2023, as a percent of revenue, partially offset by the overall decrease in our gross profit margin, as noted above.
During the year, we initiated significant restructuring actions on businesses heavily impacted by the continuing decline in activity. With these actions, we expect our overall cost structure to decline. We expect to continue to monitor expenses closely to maintain the benefit of our efforts to optimize our organizational cost structures. At the same time, we plan to invest appropriately to enable the business to grow in the future and enhance our productivity, technology and digital capabilities. We are focused on managing costs as efficiently as possible in the short term while continuing to progress transformational actions aligned with our strategic priorities.
32
Part II |
Consolidated Results - 2024 compared to 2023
The following table presents selected consolidated financial data for 2024 as compared to 2023.
(in millions, except per share data) |
|
2024 |
|
|
2023 |
|
|
Reported |
|
|
Variance in |
|
|
Variance in |
|
|||||
|
|
|
|
|
|
|
|
|
|
|
|
|
|
|
|
|||||
Revenues from services |
|
$ |
17,853.9 |
|
|
$ |
18,914.5 |
|
|
|
(5.6 |
)% |
|
|
(3.4 |
)% |
|
|
(3.0 |
)% |
Cost of services |
|
|
14,767.1 |
|
|
|
15,556.5 |
|
|
|
(5.1 |
) |
|
|
(2.8 |
) |
|
|
|
|
Gross profit |
|
|
3,086.8 |
|
|
|
3,358.0 |
|
|
|
(8.1 |
) |
|
|
(6.2 |
) |
|
|
(5.9 |
) |
Gross profit margin |
|
|
17.3 |
% |
|
|
17.8 |
% |
|
|
|
|
|
|
|
|
|
|||
Selling and administrative expenses, excluding goodwill impairment charges |
|
|
2,780.8 |
|
|
|
3,047.1 |
|
|
|
(8.7 |
) |
|
|
(7.1 |
) |
|
|
|
|
Goodwill impairment charges |
|
|
— |
|
|
|
55.1 |
|
|
|
|
|
|
|
|
|
|
|||
Selling and administrative expenses |
|
|
2,780.8 |
|
|
|
3,102.2 |
|
|
|
(10.4 |
) |
|
|
(8.8 |
) |
|
|
(8.5 |
) |
Selling and administrative expenses as a % of revenues |
|
|
15.6 |
% |
|
|
16.4 |
% |
|
|
|
|
|
|
|
|
|
|||
Operating profit |
|
|
306.0 |
|
|
|
255.8 |
|
|
|
19.6 |
|
|
|
25.2 |
|
|
|
25.4 |
|
Operating profit margin |
|
|
1.7 |
% |
|
|
1.4 |
% |
|
|
|
|
|
|
|
|
|
|||
Net interest expense |
|
|
56.7 |
|
|
|
45.5 |
|
|
|
|
|
|
|
|
|
|
|||
Other expenses (income), net |
|
|
(7.5 |
) |
|
|
4.4 |
|
|
|
|
|
|
|
|
|
|
|||
Earnings before income taxes |
|
|
256.8 |
|
|
|
205.9 |
|
|
|
24.7 |
|
|
|
31.1 |
|
|
|
|
|
Provision for income taxes |
|
|
111.7 |
|
|
|
117.1 |
|
|
|
(4.6 |
) |
|
|
|
|
|
|
||
Effective income tax rate |
|
|
43.5 |
% |
|
|
56.9 |
% |
|
|
|
|
|
|
|
|
|
|||
Net earnings |
|
$ |
145.1 |
|
|
$ |
88.8 |
|
|
|
63.5 |
|
|
|
71.8 |
|
|
|
|
|
Net earnings per share - diluted |
|
$ |
3.01 |
|
|
$ |
1.76 |
|
|
|
70.6 |
|
|
|
79.3 |
|
|
|
|
|
Weighted average shares - diluted |
|
|
48.3 |
|
|
|
50.4 |
|
|
|
(4.2 |
)% |
|
|
|
|
|
|
||
The year-over-year decrease in revenues from services of -5.6% (-3.4% in constant currency and -3.0% in organic constant currency) was attributed to:
33
Part II |
The year-over-year 50 basis point decrease in gross profit margin was primarily attributed to:
The -10.4% decrease in selling and administrative expenses in the year ended December 31, 2024 (-8.8% in constant currency; -8.5% in organic constant currency) was primarily attributed to:
Selling and administrative expenses as a percent of revenues decreased 80 basis points in the year ended December 31, 2024 compared to the year ended December 31, 2023 due primarily to:
Interest and other expenses, net is comprised of interest, foreign exchange gains and losses and other miscellaneous non-operating income and expenses, including those associated with noncontrolling interests. Interest expense, net was $56.7 in 2024 compared to $45.5 in 2023 primarily due to increased revolver and other short-term borrowings at a higher interest rate during the period. Foreign exchange loss, net was $6.2 in 2024 compared to $21.8 in 2023 primarily due to a reduction in foreign currency exchange losses in Argentina. Miscellaneous income, net was $13.7 in 2024 compared to $17.4 in 2023.
We recorded income tax expense at an effective rate of 43.5% for 2024, as compared to an effective rate of 56.9% for 2023. The 2024 rate was lower than the 2023 rate primarily due to a higher level of pre-tax earnings with a more beneficial mix driven by fewer restructuring costs in certain countries for which we did not recognize a corresponding tax benefit due to valuation allowances and the Netherlands non-deductible goodwill impairment charge recorded in 2023. The 43.5% effective tax rate for 2024 was higher than the United States Federal statutory rate of 21% primarily due to restructuring costs in certain countries for which we did not recognize a corresponding tax benefit due to valuation allowances, the French business tax and the overall mix of earnings.
Net earnings per share - diluted was $3.01 in 2024 compared to $1.76 in 2023. Restructuring costs recorded in 2024 and 2023 negatively impacted net earnings per share - diluted by approximately $1.10 and $2.74 per share, net of tax, in 2024 and 2023, respectively. Losses related to our Proservia Germany wind down in 2024 unfavorably impacted net earnings per share - diluted by approximately $0.19, net of tax, in 2024. Foreign currency exchange rates in 2024 unfavorably impacted net earnings per share - diluted by approximately $0.15 per share, net of tax, in 2024. The pension settlement expense recorded in 2024 and 2023 negatively impacted net earnings per share - diluted by approximately $0.08 and $0.12, net of tax, in 2024 and 2023, respectively. Goodwill and other impairment charges recorded in 2023 negatively impacted net earnings per share - diluted by approximately $1.13 per share, net of tax, in 2023, respectively.
Weighted average shares - diluted decreased to 48.3 million in 2024 from 50.4 million in 2023. This decrease was due to the impact of share repurchases completed in 2024, partially offset by grants of share-based awards.
34
Part II |
Segment Results
We evaluate performance based on operating unit profit (“OUP”), which is equal to segment revenues less direct costs and branch and national headquarters operating costs. This profit measure does not include goodwill and intangible asset impairment charges or amortization of intangible assets related to acquisitions, corporate expenses, interest and other income and expense amounts or income taxes.
Americas
In the Americas, revenues from services decreased -4.3% (increase of 3.1% in constant currency) in 2024 compared to 2023. In the United States, revenues from services decreased -3.5% in 2024 compared to 2023, primarily driven by a $105.4 decrease in demand for our Manpower and Experis staffing/interim services and a $6.7 decrease in demand for our permanent recruitment services, partially offset by a $7.9 increase in demand for our Right Management outplacement services. In Other Americas, revenues from services decreased -5.8% (increase of 15.2% in constant currency) in 2024 compared to 2023 primarily driven by the $325.8 unfavorable impact of foreign currency exchange rates, partially offset by a $202.1 increase in demand for our Manpower and Experis staffing/interim services and a $24.6 increase in demand for our TBO business. The constant currency increase in Other Americas was primarily due to inflation in Argentina. Within our Other Americas segment, we experienced decreases in Argentina and Canada of $60.6, or -32.4%, and $43.1, or -12.1%, respectively (125.3% and -10.8%, respectively, in constant currency), partially offset by a revenue increase in Mexico of $3.9, or 1.6% (4.5% in constant currency).
Gross profit margin decreased 50 basis points in 2024 compared to 2023. This decrease was primarily due to decreased margins in our Experis interim services, which contributed 120 basis points to the decrease. These decreases were partially offset by favorable impacts of currency exchange rates, which had a 50 basis point impact and increased margins in our Right Management outplacement business, which had a 20 basis point impact.
Selling and administrative expenses decreased -4.9% (increase of 0.1% in constant currency) in 2024 compared to 2023, primarily driven by the $43.1 favorable impact of currency exchange rates and a $9.5 decrease in consulting and outside services costs, partially offset by an $11.6 increase in salary related costs.
OUP decreased -14.5% (-8.9% in constant currency) in 2024, which represents a 3.4% OUP margin, a decrease from 3.8% in 2023. This decrease was primarily due to decreased profitability in our United States business of $16.7, which experienced decreased activity in our higher-margin permanent recruitment business, as noted above, partially offset by decreases to selling and administrative expenses as a percent of revenue. In the United States, OUP margin decreased to 2.8% in 2024 from 3.3% in 2023 primarily due to decreased activity in our higher-margin permanent recruitment and Manpower and Experis staffing/interim businesses, as noted above, partially offset by a decrease in our selling and administrative expenses as a percent of revenue. Other Americas OUP margin decreased to 4.4% in 2024 from 4.6% in 2023 primarily due to an increase in our selling and administrative expenses as a percent of revenue and decreased gross profit margins across our staffing and interim services.
Southern Europe
In Southern Europe, revenues from services decreased -3.5% (-3.3% in constant currency and -3.1% in organic constant currency) in 2024 compared to 2023. In France, revenues from services decreased -5.1% (-5.1% in constant currency) in 2024 compared to 2023, primarily driven by a $248.2 decrease in demand for our Manpower staffing services, partially offset by a $12.6 increase in demand for our Right Management outplacement services. In Italy, revenues from services decreased -1.9% (-1.8% in constant currency) in 2024 compared to 2023, primarily driven by a $24.7 decrease in demand for our Manpower staffing services and a $7.0 decrease in demand for our permanent recruitment services. In Other Southern Europe, revenues from services decreased -0.9% (flat in constant currency and increase of 0.6% in organic constant currency) in 2024 compared to 2023, primarily driven by the $16.2 unfavorable impact of currency exchange rates and an $18.9 decrease in demand for our Experis solutions services, partially offset by a $13.5 increase in demand in our TBO business and an $8.8 increase in demand for our Manpower and Experis staffing/interim services. Within our Other Southern Europe segment, we experienced revenue decreases in Switzerland of $50.4, or -10.4% (-12.2% in constant currency), partially offset by a revenue increase in Spain of $18.1, or 3.7% (3.7% in constant currency).
Gross profit margin decreased 50 basis points in 2024 compared to 2023. This decrease was primarily due to decreased activity in our higher margin Manpower staffing services, which contributed 30 basis points to the decrease, a decrease of activity in our permanent recruitment services, which contributed 20 basis points to the decrease and decreases across our Experis solutions services, which contributed 10 basis points to the decrease. These contributions were partially offset by increased demand in our higher-margin Right Management outplacement business which had a 10 basis point impact.
Selling and administrative expenses decreased -3.7% (-3.6% in constant currency and -3.3% in organic constant currency) during 2024 compared to 2023 primarily due to a $12.6 decrease in salary-related costs, a $7.5 decrease in restructuring related expenses, a $6.8 decrease in bonuses and sales commissions and a $4.3 decrease in consulting and outside services costs.
35
Part II |
OUP decreased -15.0% (-14.8% in constant currency and -15.2% in organic constant currency) in 2024, which represents a 3.7% OUP margin, a decrease from 4.2% in 2023. This OUP decrease was primarily due to decreased profitability in the France reporting unit of $36.4. In France, the OUP margin decreased to 3.3% in 2024 compared to 3.9% in 2023 primarily driven by an increase in selling and administrative expenses as a percent of revenue and a decrease in our higher-margin permanent recruitment business. In Italy, the OUP margin decreased to 6.7% in 2024 from 7.3% in 2023 primarily driven by an increase in selling and administrative expenses as a percent of revenue and a decrease in our higher-margin permanent recruitment business. In Other Southern Europe, the OUP margin decreased to 2.0% in 2024 from 2.3% in 2023 primarily due to a decrease in gross profit margin as we saw decreased activity in higher-margin Experis solutions services, as noted above, partially offset by a decrease in selling and administrative expenses as a percent of revenue.
Northern Europe
In Northern Europe, the largest country operations include the United Kingdom, the Nordics, Germany, the Netherlands and Belgium (comprising 35%, 19%, 14%, 11% and 9%, respectively, of Northern Europe’s revenues). In the Northern Europe region, revenues from services decreased -11.8% (-12.9% in constant currency) in 2024 compared to 2023, primarily due to decreased demand of $390.1 for our Manpower and Experis staffing/interim services, decreased demand of $33.7 in our permanent recruitment business and decreased demand of $78.7 for our Experis solutions services, partially offset by the $39.5 favorable impact of currency exchange rates, increased demand of $11.9 within our MSP business and increased demand of $6.2 for our Right Management outplacement services. Within our Northern Europe segment, we experienced revenue decreases in the United Kingdom of $157.3, the Nordics of $175.2, Germany of $84.5, the Netherlands of $6.7 and Belgium of $10.9, which represented revenue decreases of -12.1%, -21.8%, -15.1%, -1.8% and -3.4%, respectively (-14.5%, -21.2%, -15.2%, -1.8% and -3.4%, respectively, in constant currency).
Gross profit margin increased by 10 basis points in 2024 compared to 2023 primarily due to increased activity in our MSP business, which contributed 40 basis points to the increase, a shift in business mix towards our higher-margin Right Management outplacement services, which contributed 30 basis points to the increase, and the wind down of our lower margin Germany Proservia business in 2023. These contributions were partially offset by decreased activity in our permanent recruitment business, which had a 40 basis point unfavorable impact and decreased activity in our higher margin Manpower staffing services, which had a 20 basis point unfavorable impact.
Selling and administrative expenses decreased -18.9% (-19.7% in constant currency) in 2024 compared to 2023. The decrease is primarily driven by a $45.3 decrease in total personnel costs as we experience the impacts of significant restructuring actions taken in 2023 and $30.6 in restructuring costs incurred in 2024 compared to $120.4 in 2023.
OUP in Northern Europe improved 61.8% (60.9% in constant currency) in 2024, which represents a -1.3% OUP margin, an increase from -3.1% in 2023. The OUP improvement was driven by an OUP improvement in Germany of $92.9, partially offset by a decrease in profitability in the Nordics, which experienced an aggregate decrease of $12.5. The OUP improvement was also driven by a decrease in selling and administrative expenses as we saw the effects of restructuring actions taken in the prior year period, as noted above.
APME
Revenues from services decreased -6.9% (-2.3% in constant currency and an increase of 1.2% in organic constant currency) in 2024 compared to 2023. In Japan, revenues from services increased 0.5% (8.4% in constant currency) primarily driven by a $94.1 increase in demand for our Manpower and Experis staffing/interim services, partially offset by the $89.1 unfavorable impact of currency exchange rates. In Australia, revenues from services decreased -39.3% (-38.9% in constant currency), primarily driven by a $57.0 decrease in our permanent recruitment business driven by the non-recurrence of a Talent Solutions RPO government contract from the prior year period and a $27.3 decrease in demand for our Manpower and Experis staffing/interim services.
Gross profit margin decreased 70 basis points in 2024 compared to 2023 primarily due to decreased activity in our permanent recruitment business, particularly Talent Solutions RPO, which contributed 140 basis points to the decrease, and a decrease in activity across our higher-margin outplacement services, which contributed 20 basis points to the decrease. These contributions were partially offset by improvement in our staffing/interim margins, which had a 90 basis point impact.
Selling and administrative expenses decreased -11.0% (-6.7% in constant currency and -4.3% in organic constant currency) in 2024 compared 2023. The decrease is primarily driven by the $12.5 favorable impact of currency exchange rates, an $11.6 decrease in salary related costs from a reduction in headcount and a $9.3 decrease in office lease costs and other office related costs and a $4.4 decrease in consulting and outside services costs.
OUP in APME decreased -9.7% (-4.0% in constant currency and -1.4% in organic constant currency), in 2024, which represents a 3.9% OUP margin, a decrease from 4.0% in 2023. This OUP decrease was primarily driven by the decreased activity in our permanent recruitment business, partially offset by a decrease in selling and administrative expenses, as noted above.
36
Part II |
Financial Measures
Constant Currency And Organic Constant Currency Reconciliation
Certain constant currency and organic constant currency percent variances are discussed throughout this report. A reconciliation of these Non-GAAP percent variances to the percent variances calculated based on our annual GAAP financial results is provided below. (See Financial Measures - Constant Currency and Organic Constant Currency on page 31 for information.)
Amounts represent 2024 |
|
Reported |
|
|
Reported |
|
|
Impact of |
|
|
Variance in |
|
|
Impact of |
|
|
Organic |
|
||||||
|
|
|
|
|
|
|
|
|
|
|
|
|
|
|
|
|
|
|
||||||
Revenues from Services |
|
|
|
|
|
|
|
|
|
|
|
|
|
|
|
|
|
|
||||||
Americas: |
|
|
|
|
|
|
|
|
|
|
|
|
|
|
|
|
|
|
||||||
United States |
|
$ |
2,766.6 |
|
|
|
(3.5 |
)% |
|
|
— |
|
|
|
(3.5 |
)% |
|
|
— |
|
|
|
(3.5 |
)% |
Other Americas |
|
|
1,458.3 |
|
|
|
(5.8 |
) |
|
|
(21.0 |
) |
|
|
15.2 |
|
|
|
— |
|
|
|
15.2 |
|
|
|
|
4,224.9 |
|
|
|
(4.3 |
) |
|
|
(7.4 |
) |
|
|
3.1 |
|
|
|
— |
|
|
|
3.1 |
|
Southern Europe: |
|
|
|
|
|
|
|
|
|
|
|
|
|
|
|
|
|
|
||||||
France |
|
|
4,618.4 |
|
|
|
(5.1 |
) |
|
|
— |
|
|
|
(5.1 |
) |
|
|
— |
|
|
|
(5.1 |
) |
Italy |
|
|
1,677.0 |
|
|
|
(1.9 |
) |
|
|
(0.1 |
) |
|
|
(1.8 |
) |
|
|
— |
|
|
|
(1.8 |
) |
Other Southern Europe |
|
|
1,922.9 |
|
|
|
(0.9 |
) |
|
|
(0.9 |
) |
|
|
— |
|
|
|
(0.6 |
) |
|
|
0.6 |
|
|
|
|
8,218.3 |
|
|
|
(3.5 |
) |
|
|
(0.2 |
) |
|
|
(3.3 |
) |
|
|
(0.2 |
) |
|
|
(3.1 |
) |
Northern Europe |
|
|
3,304.3 |
|
|
|
(11.8 |
) |
|
|
1.1 |
|
|
|
(12.9 |
) |
|
|
— |
|
|
|
(12.9 |
) |
APME |
|
|
2,161.3 |
|
|
|
(6.9 |
) |
|
|
(4.6 |
) |
|
|
(2.3 |
) |
|
|
(3.5 |
) |
|
|
1.2 |
|
|
|
|
17,908.8 |
|
|
|
|
|
|
|
|
|
|
|
|
|
|
|
|
|||||
Intercompany Eliminations |
|
|
(54.9 |
) |
|
|
|
|
|
|
|
|
|
|
|
|
|
|
|
|||||
ManpowerGroup |
|
$ |
17,853.9 |
|
|
|
(5.6 |
)% |
|
|
(2.2 |
)% |
|
|
(3.4 |
)% |
|
|
(0.4 |
)% |
|
|
(3.0 |
)% |
Gross Profit - ManpowerGroup |
|
$ |
3,086.8 |
|
|
|
(8.1 |
)% |
|
|
(1.9 |
)% |
|
|
(6.2 |
)% |
|
|
(0.3 |
)% |
|
|
(5.9 |
)% |
Operating Unit Profit (Loss) |
|
|
|
|
|
|
|
|
|
|
|
|
|
|
|
|
|
|
||||||
Americas: |
|
|
|
|
|
|
|
|
|
|
|
|
|
|
|
|
|
|
||||||
United States |
|
$ |
77.7 |
|
|
|
(17.6 |
)% |
|
|
— |
|
|
|
(17.6 |
)% |
|
|
— |
|
|
|
(17.6 |
)% |
Other Americas |
|
|
63.9 |
|
|
|
(10.3 |
) |
|
|
(12.9 |
) |
|
|
2.6 |
|
|
|
— |
|
|
|
2.6 |
|
|
|
|
141.6 |
|
|
|
(14.5 |
) |
|
|
(5.6 |
) |
|
|
(8.9 |
) |
|
|
— |
|
|
|
(8.9 |
) |
Southern Europe: |
|
|
|
|
|
|
|
|
|
|
|
|
|
|
|
|
|
|
||||||
France |
|
|
151.8 |
|
|
|
(19.4 |
) |
|
|
— |
|
|
|
(19.4 |
) |
|
|
— |
|
|
|
(19.4 |
) |
Italy |
|
|
113.1 |
|
|
|
(9.3 |
) |
|
|
0.1 |
|
|
|
(9.4 |
) |
|
|
— |
|
|
|
(9.4 |
) |
Other Southern Europe |
|
|
39.2 |
|
|
|
(12.5 |
) |
|
|
(1.6 |
) |
|
|
(10.9 |
) |
|
|
3.1 |
|
|
|
(14.0 |
) |
|
|
|
304.1 |
|
|
|
(15.0 |
) |
|
|
(0.2 |
) |
|
|
(14.8 |
) |
|
|
0.4 |
|
|
|
(15.2 |
) |
Northern Europe |
|
|
(44.6 |
) |
|
|
61.8 |
|
|
|
0.9 |
|
|
|
60.9 |
|
|
|
— |
|
|
|
60.9 |
|
APME |
|
|
83.7 |
|
|
|
(9.7 |
) |
|
|
(6.0 |
) |
|
|
(3.7 |
) |
|
|
(2.3 |
) |
|
|
(1.4 |
) |
Operating Unit Profit - ManpowerGroup |
|
$ |
484.8 |
|
|
|
(2.9 |
)% |
|
|
(2.9 |
)% |
|
|
— |
|
|
|
(0.1 |
)% |
|
|
0.1 |
% |
Cash Sources and Uses
Cash used to fund our operations is primarily generated through operating activities and provided by our existing credit facilities. We believe our available cash and existing credit facilities are sufficient to cover our cash needs for the foreseeable future. We assess and monitor our liquidity and capital resources globally. We use a global cash pooling arrangement, intercompany lending, and some local credit lines to meet funding needs and allocate our capital resources among our various entities. As of December 31, 2024, we had $348.8 of cash held by foreign subsidiaries. We have historically made and anticipate future cash repatriations to the United States from certain foreign subsidiaries to fund corporate activities. As of December 31, 2024, deferred taxes related to non-United States withholding and other taxes were provided on $1,353.5 of accumulated unremitted earnings of non-United States subsidiaries that may be remitted to the United States. As of December 31, 2024 and 2023, we have recorded a deferred tax liability of $25.9 and $23.1, respectively, related to these non-United States earnings that may be remitted. As of December 31, 2024, we had an additional $289.4 of accumulated unremitted earnings of non-United States subsidiaries for which we have not provided deferred taxes as amounts are deemed indefinitely reinvested. We have not estimated the deferred tax liability on these earnings as such estimation is not practicable to determine or immaterial to the financial statements.
37
Part II |
Our principal ongoing cash needs are to finance working capital, capital expenditures, debt payments, interest expense, dividends, share repurchases and acquisitions. Working capital is primarily in the form of trade receivables, which generally increase as revenues increase. The amount of financing necessary to support revenue growth depends on receivables turnover, which differs in each market where we operate.
Cash provided by operating activities was $309.2, $348.2 and $423.3 for 2024, 2023 and 2022, respectively. Changes in operating assets and liabilities generated $65.4 of cash, compared to $98.7 generated and $139.7 utilized in 2024, 2023 and 2022, respectively. The decrease in 2024 from 2023 was primarily attributable to decreased accounts receivable collections and an increase in capitalized implementation costs related to our cloud computing arrangements, partially offset by an increase in accounts payable. The change in 2023 from 2022 was primarily attributable to a decrease in accounts receivable due to the slowdown in the demand for our services.
Accounts receivable decreased to $4,297.2 as of December 31, 2024 from $4,830.0 as of December 31, 2023. The decrease was partly attributable to the impact of changes in currency exchange rates. DSO decreased by two and a half days from December 31, 2023 to 52 days as of December 31, 2024 due to an increased emphasis on cash collections.
Cash used in investing activities were $68.2, $74.1 and $85.3 for 2024, 2023 and 2022, respectively. Capital expenditures were $51.1, $78.2 and $75.6 during 2024, 2023 and 2022, respectively. These expenditures were comprised of purchases of computer equipment, office furniture and other costs related to office openings and refurbishments, as well as capitalized software costs of $10.1, $12.0 and $34.2 in 2024, 2023 and 2022, respectively. The higher expenditures in 2022 were primarily due to additional technology investments and the timing of capital expenditures.
Cash used in financing activities were $282.4, $349.5 and $482.1 for 2024, 2023 and 2022, respectively. Net debt borrowings were $16.1 in 2024 as compared to net debt repayments of $16.2 and $58.7 in 2023 and 2022, respectively. The larger repayments in 2022 were mainly due to the $75.0 repayment of our revolving credit facility to clear the outstanding borrowings as of December 31, 2021 related to an Experis acquisition. The acquisition was funded through cash on hand and a $150.0 draw on our revolving credit facility on October 1, 2021 which was repaid in 2022.
The Board of Directors authorized the repurchase of 5.0 million and 4.0 million shares of our common stock in August 2023 and August 2021, respectively. Share repurchases may be made from time to time through a variety of methods, including open market purchases, block transactions, privately negotiated transactions or similar facilities. In 2024, we repurchased a total of 2.0 million shares under the 2023 authorization, at a total cost of $140.9 including excise tax on share repurchases of $0.9. In 2023, we repurchased a total of 2.4 million shares comprised of 2.0 million shares under the 2021 authorization and 0.4 million shares under the 2023 authorization, at a total cost of $181.5 including excise tax on share repurchases of $1.7. In 2022, we repurchased a total of 3.2 million shares comprised of 1.2 million shares under the 2019 authorization and 2.0 million shares under the 2021 authorization, at a total cost of $270.0. As of December 31, 2024, there were 2.6 million shares remaining authorized for repurchase under the 2023 authorization and no shares remaining authorized for repurchase under the 2021 authorization.
During 2024, 2023 and 2022, the Board of Directors declared total cash dividends of $3.08, $2.94 and $2.72 per share, respectively, resulting in total dividend payments of $145.8, $144.3 and $139.9, respectively.
We have aggregate commitments of $2,268.2 related to debt, operating leases, purchase obligations for global technology and financial shared services, restructuring costs, transition tax resulting from the Tax Act and certain other commitments, as follows:
(in millions) |
|
Total |
|
|
2025 |
|
|
2026-2027 |
|
|
2028-2029 |
|
|
Thereafter |
|
|||||
|
|
|
|
|
|
|
|
|
|
|
|
|
|
|
|
|||||
Long-term debt including interest |
|
$ |
1,017.1 |
|
|
$ |
26.0 |
|
|
$ |
976.6 |
|
|
$ |
14.5 |
|
|
$ |
— |
|
Short-term borrowings |
|
|
21.0 |
|
|
|
21.0 |
|
|
|
— |
|
|
|
— |
|
|
|
— |
|
Purchase obligations for global technology and |
|
|
521.9 |
|
|
|
116.4 |
|
|
|
181.8 |
|
|
|
137.5 |
|
|
|
86.2 |
|
Operating leases |
|
|
420.4 |
|
|
|
111.5 |
|
|
|
155.0 |
|
|
|
88.3 |
|
|
|
65.6 |
|
Pension funding commitments |
|
|
73.7 |
|
|
|
8.0 |
|
|
|
7.7 |
|
|
|
9.0 |
|
|
|
49.0 |
|
Restructuring costs |
|
|
46.5 |
|
|
|
44.1 |
|
|
|
2.3 |
|
|
|
0.1 |
|
|
|
— |
|
Transition tax resulting from the Tax Act |
|
|
37.2 |
|
|
|
37.2 |
|
|
|
— |
|
|
|
— |
|
|
|
— |
|
Other(a) |
|
|
130.4 |
|
|
|
98.6 |
|
|
|
31.7 |
|
|
|
0.1 |
|
|
|
— |
|
|
|
$ |
2,268.2 |
|
|
$ |
462.8 |
|
|
$ |
1,355.1 |
|
|
$ |
249.5 |
|
|
$ |
200.8 |
|
Our liability for unrecognized tax benefits, including related interest and penalties, of $11.4 is excluded from the commitments above as we cannot determine the years in which these positions might ultimately be settled.
38
Part II |
We recorded net restructuring costs of $53.6, $149.2 and $3.6 in 2024, 2023 and 2022, respectively, in selling and administrative expenses, primarily related to severance, office closures and consolidations, and professional and other fees related to restructuring in multiple countries and territories. The costs paid out of our restructuring reserve were $93.7 in 2024.
We have entered into guarantee contracts and stand-by letters of credit that total $571.0 as of December 31, 2024 ($524.2 for guarantees and $46.8 for stand-by letters of credit). The guarantees primarily relate to staffing license requirements, operating leases and indebtedness. The stand-by letters of credit mainly relate to workers’ compensation in the United States. If certain conditions were met under these arrangements, we would be required to satisfy our obligation in cash. Due to the nature of these arrangements and our historical experience, we do not expect to make any significant payments under these arrangements. Therefore, they have been excluded from our aggregate commitments identified above. The cost of these guarantees and letters of credit was $1.4 for 2024.
Total capitalization as of December 31, 2024 was $3,079.7, comprised of $952.8 in debt and $2,126.9 in equity. Debt as a percentage of total capitalization was 31%, 31% and 29% as of December 31, 2024, 2023 and 2022, respectively.
Acquisitions
From time to time, we acquire and invest in companies throughout the world, including franchises. The total cash consideration paid for acquisitions, net of cash acquired, for the years ended December 31, 2024, 2023, and 2022 was $7.7, $0.0 and $20.2, respectively. The 2024 payments represent a consideration payment for a franchise in the United States and contingent consideration payments related to a previous acquisition. The 2022 payments primarily represent a consideration payment for the acquisition of Tingari, a talent solutions company in France. Also included in the 2022 payments are consideration payments for franchises in the United States and contingent consideration payments related to previous acquisitions, of which $3.8 had been recognized as a liability at the acquisition date.
As of December 31, 2024, goodwill and other intangible assets resulting from the 2024 acquisitions were $1.4 and $3.1, respectively. We did not make any acquisitions in 2023.
Dispositions
Occasionally, we dispose of parts of our operations based on risk considerations and to optimize our global strategic and geographic footprint, as well as improve our overall efficiency. On October 15, 2024, we disposed of our Austria business in our Southern Europe segment for cash proceeds of $0.1 and simultaneously entered into a franchising agreement. In connection with the disposition, we recognized a one-time net loss on disposition of $7.7, of which $4.9 was included in selling and administrative expenses and $2.8 was included in interest and other expenses in the Consolidated Statements of Operations in the year ended December 31, 2024.
On November 1, 2024, we disposed of our South Korea business in our APME segment for cash proceeds of $20.6 and simultaneously entered into a franchising agreement under which the new ownership will operate Manpower Korea under the Manpower brand. In connection with the disposition, we recognized a one-time net loss on disposition of $0.4, consisting of a $3.3 gain in selling and administrative expenses and a $3.7 loss in interest and other expenses in the Consolidated Statements of Operations in the year ended December 31, 2024. The franchise arrangement represents a significant component of the transaction. Our South Korea business contributed $349.9 and $324.2 of revenues for the year ended December 31, 2023 and 2022, respectively.
On September 29, 2023, we disposed of our Philippines business in our APME segment for total consideration of $6.5. In connection with the disposition, we recognized a one-time net loss on disposition of $1.3, which was included in interest and other expenses in the Consolidated Statements of Operations in the year ended December 31, 2023.
On January 17, 2022, we disposed of our Russia business in our Northern Europe segment for cash proceeds of $3.2. In connection with the disposition, we recognized a one-time net loss on disposition of $8.0, of which $9.7 was included in selling and administrative expenses and a gain of $1.7 was included in interest and other expenses in the Consolidated Statements of Operations in the year ended December 31, 2022. On September 30, 2022, our Belgium business disposed of its Service Voucher Division and recognized a one-time gain of $4.1, which was included in selling and administrative expenses in the Consolidated Statements of Operations in the year ended December 31, 2022. On December 15, 2022, we disposed of our Hungary business in our Southern Europe segment and recognized a one-time loss of $2.1, of which $0.9 was included in selling and administrative expenses and $1.2 was included in interest and other expenses in the Consolidated Statements of Operations in the year ended December 31, 2022.
39
Part II |
Euro Notes
On June 30, 2022, we offered and sold €400.0 aggregate principal amount of the Company’s 3.50% notes due June 30, 2027 (the “€400.0 notes”). The proceeds from the €400.0 notes were used in July 2022 to repay our €400.0 1.875% notes due September 11, 2022. The €400.0 notes were issued at a price of 99.465% to yield an effective interest rate of 3.514%, net of a favorable impact of a forward starting interest rate swap. Interest on the €400.0 notes is payable in arrears on June 30 of each year. The Notes are unsecured senior obligations and rank equally with all of the Company’s existing and future senior unsecured debt and other liabilities.
On June 22, 2018, we offered and sold €500.0 aggregate principal amount of the Company’s 1.750% notes due June 2026 (the “€500.0 notes”). The net proceeds from the €500.0 notes of €495.7 were used to repay our €350.0 notes due June 22, 2018, with the remaining balance used for general corporate purposes, which included share repurchases. The €500.0 notes were issued at a price of 99.564% to yield an effective interest rate of 1.809%. Interest on the €500.0 notes is payable in arrears on June 22 of each year. The €500.0 notes are unsecured senior obligations and rank equally with all of the Company’s existing and future senior unsecured debt and other liabilities.
Both the €500.0 notes and €400.0 notes contain certain customary non-financial restrictive covenants and events of default and are unsecured senior obligations and rank equally with all of our existing and future senior unsecured debt and other liabilities. These notes have been designated as a hedge of our net investment in subsidiaries with a Euro-functional currency as of December 31, 2024. Since our net investment in these subsidiaries exceeds the respective amount of the designated borrowings, the related translation gains or losses are included as a component of accumulated other comprehensive loss. (See the Significant Matters Affecting Results of Operations section and Notes 8 and 12 to the Consolidated Financial Statements found in Item 8. "Financial Statements and Supplementary Data" for further information.)
Revolving Credit Agreement
On May 27, 2022, we entered into a new Credit Agreement (the “Credit Agreement”) with a syndicate of commercial banks with a termination date of May 27, 2027 to replace our previous $600.0 revolving credit facility. The Credit Agreement includes terms generally consistent with our previous 5-year credit facility, except the Credit Agreement uses the Secured Overnight Financing Rate (SOFR) as the base rate index instead of London Interbank Offered Rate (LIBOR). The Credit Agreement allows for borrowing of $600.0 in various currencies, and up to $150.0 may be used for the issuance of stand-by letters of credit. We had no borrowings under this facility as of December 31, 2024 and 2023. Outstanding letters of credit issued totaled $0.4, hence additional borrowings of $599.6 were available to us under the facility as of both December 31, 2024 and 2023.
Under the Credit Agreement, a credit ratings-based pricing grid determines the facility fee and the credit spread that we add to the applicable interbank borrowing rate on all borrowings. At our current credit rating, the annual facility fee is 10 basis points paid on the entire facility and the credit spread is 102.5 basis points on any borrowings. A downgrade from both credit agencies would unfavorably impact our interest and facility fees and result in additional costs ranging from approximately $0.2 to $0.5 annually.
The Credit Agreement contains customary restrictive covenants pertaining to our management and operations, including limitations on the amount of subsidiary debt that we may incur and limitations on our ability to pledge assets, as well as financial covenants requiring, among other things, that we comply with a leverage ratio (Net Debt-to-Net Earnings before interest and other expenses, provision for income taxes, intangible asset amortization expense, depreciation and amortization expense ("EBITDA")) of not greater than 3.5 to 1 and a fixed charge coverage ratio of not less than 1.5 to 1. The Credit Agreement also contains customary events of default, including, among others, payment defaults, material inaccuracy of representations and warranties, covenant defaults, bankruptcy or involuntary proceedings, certain monetary and non-monetary judgements, change of control and customary ERISA defaults.
As defined in the Credit Agreement, we had a net Debt-to-EBITDA ratio of 1.97 to 1 (compared to the maximum allowable ratio of 3.5 to 1) and a Fixed Charge Coverage ratio of 3.27 to 1 (compared to the minimum required ratio of 1.5 to 1) as of December 31, 2024.
Other
In addition to the previously mentioned facilities, we maintain separate bank credit lines with financial institutions to meet working capital needs of our subsidiary operations. As of December 31, 2024, such uncommitted credit lines totaled $290.5, of which $266.1 was unused. Under the Credit Agreement, total subsidiary borrowings cannot exceed $300.0 in the first, second and fourth quarters, and $600.0 in the third quarter of each year. Additional borrowings of $266.1 could have been made under these lines as of December 31, 2024.
40
Part II |
Our long-term debt has a rating of Baa1 with stable outlook from Moody's Investor Services and BBB from Standard and Poor's with negative outlook. Both of the credit ratings are investment grade. Rating agencies use proprietary methodology in determining their ratings and outlook which includes, among other things, financial ratios based upon debt levels and earnings performance.
Assessment of the Liquidity Position
We have assessed our liquidity position as of December 31, 2024 and for the near future. As of December 31, 2024, our cash and cash equivalents balance was $509.4. We also have access to the previously mentioned revolving credit facility that could have immediately provided us with up to $600.0 of additional cash, less any outstanding borrowings and letters of credit, and we have an option to request an increase to the total availability under the revolving credit facility by an additional $300.0 and each lender may participate in the requested increase at their discretion. Furthermore, we have access to the previously mentioned credit lines of up to $300.0 ($600.0 in the third quarter) to meet the working capital needs of our subsidiaries, of which $266.1 was available to use, in addition to $150.0 of uncommitted credit facilities at our parent company, as of December 31, 2024. Our €500.0 ($516.6) notes mature in June 2026, and our €400.0 ($411.8) notes mature in June 2027. Based on the above, we believe we have sufficient liquidity and capital resources to satisfy future requirements and meet our obligations currently and in the near future.
Application of Critical Accounting Policies
The preparation of our financial statements in conformity with accounting principles generally accepted in the United States requires us to make estimates and assumptions that affect the reported amounts. A discussion of the more significant estimates follows. Management has discussed the development, selection and disclosure of these estimates and assumptions with the Audit Committee of our Board of Directors.
Defined Benefit Pension Plans
We sponsor several qualified and nonqualified pension plans covering permanent employees. The most significant plans are located in Switzerland, the United Kingdom, the Netherlands, Germany and France. Annual expense relating to these plans was $18.0, $21.7 and $18.6 in 2024, 2023 and 2022, respectively. Pension expense is estimated to be approximately $15.0 in 2025.
The calculations of annual pension expense and the pension liability required at year-end include various actuarial assumptions such as discount rates, expected rate of return on plan assets, compensation increases and employee turnover rates. We review the actuarial assumptions on an annual basis and make modifications to the assumptions as necessary. We review market data and historical rates, on a country-by-country basis, to check for reasonableness in setting both the discount rate and the expected return on plan assets. We determine the discount rate based on an index of high-quality corporate bond yields and matched-funding yield curve analysis as of the end of each fiscal year. The expected return on plan assets is determined based on the expected returns of the various investment asset classes held in the plans. We estimate compensation increases and employee turnover rates for each plan based on the historical rates and the expected future rates for each respective country. Changes to any of these assumptions will impact annual expense recorded related to the plans.
In determining the estimated 2025 pension expense for non-United States plans, we used a weighted-average discount rate of 2.7% and weighted-average expected return on plan assets of 3.4%, both of which are unchanged from 2024. Absent any other changes, a 25 basis point increase in the weighted-average discount rate would increase our 2025 consolidated pension expense by $0.1, and a 25 basis point decrease in the weighted-average discount rate would increase our 2025 consolidated pension expense by $3.0. Absent any other changes, a 25 basis point increase or decrease in the weighted-average expected return on plan assets would decrease or increase our 2025 consolidated pension expense by $1.4. (See Note 9 to the Consolidated Financial Statements found in Item 8. "Financial Statements and Supplementary Data" for further information.)
Income Taxes
The accounting guidance related to uncertain tax positions requires an evaluation process for all tax positions taken that involves a review of probability for sustaining a tax position. If the probability for sustaining a tax position is more likely than not, which is a 50% threshold, then the tax position is warranted and the largest amount, based on cumulative probability, that is greater than 50% likely of being realized upon settlement is recognized. An uncertain tax position, one which does not exceed the 50% threshold, will not be recognized in the financial statements.
41
Part II |
We provide for income taxes on a quarterly basis based on an estimated annual tax rate. In determining this rate, we make estimates about taxable income for each of our largest locations worldwide, as well as the tax rate that will be in effect for each location. To the extent these estimates change during the year, or actual results differ from these estimates, our estimated annual tax rate may change between quarterly periods and may differ from the actual effective tax rate for the year.
Goodwill Impairment
In accordance with the accounting guidance on goodwill, we perform an annual impairment test of goodwill at our reporting unit level during the third quarter, or more frequently if events or circumstances change that would more likely than not reduce the fair value of our reporting units below their carrying value.
We evaluate the recoverability of goodwill utilizing an income approach that estimates the fair value of the future discounted cash flows to which the goodwill relates. This approach reflects management’s internal outlook of the reporting units, which is believed to be the best determination of value due to management’s insight and experience with the reporting units. Significant assumptions used in our goodwill impairment tests include: expected future revenue growth rates, operating unit profit margins, working capital levels, discount rates, and a terminal value multiple.
We performed our annual impairment test of our goodwill and indefinite-lived intangible assets during the third quarter of 2024, and determined that there was no impairment of our goodwill or indefinite-lived intangible assets as a result of our annual test. The excess of fair value over carrying amount for our goodwill reporting units, which exceeded 15% or more of the respective carrying amounts, was sufficient to conclude that no impairment was indicated.
While the excess of fair value over carrying amount exceeded 15% for our reporting units, we did see a lower level of excess fair value year over year in many of our North America and Europe reporting units including three of these reporting units which approximate $1,243.0 of the consolidated goodwill balance. Given the current macroeconomic conditions in these regions, our assumptions on near-term expected future revenue growth rates and operating profit margins were lower than in the prior year assessment. Market conditions in North America and Europe continue to remain challenging given the economic uncertainty including the uncertainty surrounding the timing of an inflection point for improving market conditions. Management closely monitors the results of the reporting units and comparisons to the key assumptions used in our fair value estimate at the time of our annual impairment test, in addition to operational initiatives and macroeconomic conditions, which may impact the results of the reporting units.
During the fourth quarter of 2024, in connection with the preparation of our annual financial statements, we assessed the changes in circumstances that occurred during the quarter to determine if it was more likely than not that the fair value of any reporting unit or indefinite-lived intangible assets were below its carrying amount. While we continued to see challenging market conditions in Europe which led to lower levels of revenue and OUP in certain of our reporting units than we had forecasted at the time of our impairment testing, we concluded based on our analysis performed, that the fair value of these reporting units continued to exceed the carrying value and did not identify a triggering event.
There could be significant further decreases in the operating results of our reporting units for a sustained period, which may result in a recognition of goodwill impairment that could be material to the Consolidated Financial Statements.
Item 7A. Quantitative and Qualitative Disclosures about Market Risk
Significant Matters Affecting Results of Operations
Market Risks
We are exposed to the impact of foreign currency exchange rate fluctuations and interest rate changes.
Exchange Rates
Our exposure to foreign currency exchange rates relates primarily to our foreign subsidiaries and our Euro-denominated borrowings. For our foreign subsidiaries, exchange rates impact the United States dollar value of our reported earnings, our investments in the subsidiaries and the intercompany transactions with the subsidiaries.
42
Part II |
Approximately 85% of our revenues are generated outside of the United States, with 48% generated from our European operations with a Euro-functional currency. As a result, fluctuations in the value of foreign currencies against the United States dollar, particularly the Euro, may have a significant impact on our reported results. Revenues and expenses denominated in foreign currencies are translated into United States dollars at the average exchange rates each month. Consequently, as the value of the United States dollar changes relative to the currencies of our major markets, our reported results vary.
The United States dollar strengthened in 2024 on average, where as it was generally stable relative to the currencies of our major markets during 2023. Revenues from services in constant currency were 2.2% higher than reported revenues in 2024. In 2023, revenues from services in constant currency were 0.6% higher than reported revenues. A change in the strength of the United States dollar by an additional 10% would have impacted our revenues from services by approximately 8.5% and 8.4% from the amounts reported in 2024 and 2023, respectively.
Fluctuations in currency exchange rates also impact the United States dollar amount of our shareholders’ equity. The assets and liabilities of our non-United States subsidiaries are translated into United States dollars at the exchange rates in effect at year-end. The resulting translation adjustments are recorded in shareholders’ equity as a component of accumulated other comprehensive loss. The United States dollar strengthened relative to many foreign currencies as of December 31, 2024 compared to December 31, 2023. Consequently, shareholders’ equity decreased by $4.0 as a result of the foreign currency translation as of December 31, 2024. If the United States dollar had strengthened an additional 10% as of December 31, 2024, resulting translation adjustments recorded in shareholders’ equity would have decreased by approximately $6.0 from the amounts reported.
The United States dollar weakened relative to many foreign currencies as of December 31, 2023 compared to December 31, 2022. Consequently, shareholders’ equity increased by $17.1 as a result of the foreign currency translation as of December 31, 2023. If the United States dollar had weakened an additional 10% as of December 31, 2023, resulting translation adjustments recorded in shareholders’ equity would have increased by approximately $60.0 from the amounts reported.
Although currency fluctuations impact our reported results and shareholders’ equity, such fluctuations generally do not affect our cash flow or result in actual economic gains or losses. Substantially all of our subsidiaries derive revenues and incur expenses within a single country and, consequently, do not generally incur currency risks in connection with the conduct of their normal business operations. We generally have few cross-border transfers of funds, except for transfers to the United States for payment of intercompany franchise fees and interest expense on intercompany loans, working capital loans made between the United States and our foreign subsidiaries, dividends from our foreign subsidiaries, and payments between certain countries and territories for services provided. To reduce the currency risk related to these transactions, we may borrow funds in the relevant foreign currency under our revolving credit agreement or we may enter into a forward contract to hedge the transfer.
As of December 31, 2024, we had outstanding $928.4 in principal amount of Euro-denominated notes (€900.0). These notes have been designated as a hedge of our net investment in subsidiaries with a Euro-functional currency as of December 31, 2024. Since our net investment in these subsidiaries exceeds the respective amount of the designated borrowings, both net of tax, the related translation gains or losses are included as a component of accumulated other comprehensive loss. Shareholders’ equity decreased by $61.5, net of tax, due to changes in accumulated other comprehensive loss during 2024, due to the currency impact on these designated borrowings.
The hypothetical impact of the stated change in rates on 2024 total other comprehensive income (loss) for the Euro Notes and forward contracts is as follows:
2024 (in millions) |
|
10% Depreciation |
|
10% Appreciation |
||||||
|
|
|
|
|
|
|
|
|
||
Euro Notes: |
|
|
|
|
|
|
|
|
||
€500.0, 1.81% Notes due June 2026 |
|
$ |
51.8 |
|
|
|
$ |
(51.8 |
) |
|
€400.0, 3.50% Notes due June 2027 |
|
|
41.4 |
|
|
|
|
(41.4 |
) |
|
Forward contracts: |
|
|
|
|
|
|
|
|
||
€(126.7) to $(131.9) |
|
|
13.1 |
|
|
|
|
(13.1 |
) |
|
¥340.0 to $2.2 |
|
|
(0.2 |
) |
|
|
|
0.2 |
|
|
43
Part II |
Interest Rates
Our exposure to market risk for changes in interest rates relates primarily to our variable rate debt obligations. We have historically managed interest rates through the use of a combination of fixed- and variable-rate borrowings. As of December 31, 2024, we had the following fixed- and variable-rate borrowings:
(in millions) |
|
Amount |
|
Weighted- |
||||||
|
|
|
|
|
|
|
|
|
||
Variable-rate borrowings |
|
$ |
21.0 |
|
|
|
|
33.3 |
% |
|
Fixed-rate borrowings |
|
|
931.8 |
|
|
|
|
2.6 |
% |
|
Total debt |
|
$ |
952.8 |
|
|
|
|
|
|
|
Impact of Economic Conditions
One of the principal attractions of using workforce solutions and service providers is to maintain a flexible supply of labor to meet changing economic conditions. Therefore, the industry has been and remains sensitive to economic cycles. To help minimize the effects of these economic cycles, we offer clients a continuum of services to meet their needs throughout the business cycle. We believe that the breadth of our operations and the diversity of our service mix cushion us against the impact of an adverse economic cycle in any single country or industry. However, adverse economic conditions in any of our largest markets, or in several markets simultaneously, would have a material impact on our consolidated financial results.
Recently Issued Accounting Standards
See Note 1 to the Consolidated Financial Statements found in Item 8. "Financial Statements and Supplementary Data."
44
Part II |
Item 8. Financial Statements and Supplementary Data
45
Part II |
REPORT OF INDEPENDENT REGISTERED PUBLIC ACCOUNTING FIRM
To the shareholders and the Board of Directors of ManpowerGroup Inc.
Opinion on Internal Control over Financial Reporting
We have audited the internal control over financial reporting of ManpowerGroup Inc. and subsidiaries (the “Company”) as of December 31, 2024, based on criteria established in Internal Control — Integrated Framework (2013) issued by the Committee of Sponsoring Organizations of the Treadway Commission (COSO). In our opinion, the Company maintained, in all material respects, effective internal control over financial reporting as of December 31, 2024, based on criteria established in Internal Control — Integrated Framework (2013) issued by COSO.
We have also audited, in accordance with the standards of the Public Company Accounting Oversight Board (United States) (PCAOB), the consolidated financial statements as of and for the year ended December 31, 2024, of the Company and our report dated February 19, 2025, expressed an unqualified opinion on those financial statements.
Basis for Opinion
The Company’s management is responsible for maintaining effective internal control over financial reporting and for its assessment of the effectiveness of internal control over financial reporting, included in the accompanying Management report on Internal Control over Financial Reporting. Our responsibility is to express an opinion on the Company’s internal control over financial reporting based on our audit. We are a public accounting firm registered with the PCAOB and are required to be independent with respect to the Company in accordance with the U.S. federal securities laws and the applicable rules and regulations of the Securities and Exchange Commission and the PCAOB
We conducted our audit in accordance with the standards of the PCAOB. Those standards require that we plan and perform the audit to obtain reasonable assurance about whether effective internal control over financial reporting was maintained in all material respects. Our audit included obtaining an understanding of internal control over financial reporting, assessing the risk that a material weakness exists, testing and evaluating the design and operating effectiveness of internal control based on the assessed risk, and performing such other procedures as we considered necessary in the circumstances. We believe that our audit provides a reasonable basis for our opinion.
Definition and Limitations of Internal Control over Financial Reporting
A company’s internal control over financial reporting is a process designed to provide reasonable assurance regarding the reliability of financial reporting and the preparation of financial statements for external purposes in accordance with generally accepted accounting principles. A company’s internal control over financial reporting includes those policies and procedures that (1) pertain to the maintenance of records that, in reasonable detail, accurately and fairly reflect the transactions and dispositions of the assets of the company; (2) provide reasonable assurance that transactions are recorded as necessary to permit preparation of financial statements in accordance with generally accepted accounting principles, and that receipts and expenditures of the company are being made only in accordance with authorizations of management and directors of the company; and (3) provide reasonable assurance regarding prevention or timely detection of unauthorized acquisition, use, or disposition of the company’s assets that could have a material effect on the financial statements.
Because of its inherent limitations, internal control over financial reporting may not prevent or detect misstatements. Also, projections of any evaluation of effectiveness to future periods are subject to the risk that controls may become inadequate because of changes in conditions, or that the degree of compliance with the policies or procedures may deteriorate.
/s/ Deloitte & Touche LLP
Milwaukee, Wisconsin
February 19, 2025
46
Part II |
REPORT OF INDEPENDENT REGISTERED PUBLIC ACCOUNTING FIRM
To the shareholders and the Board of Directors of ManpowerGroup Inc.
Opinion on the Financial Statements
We have audited the accompanying consolidated balance sheets of ManpowerGroup Inc. and subsidiaries (the "Company") as of December 31, 2024 and 2023, the related consolidated statements of operations, comprehensive income, shareholders' equity, and cash flows, for each of the three years in the period ended December 31, 2024, and the related notes and the schedule listed in the Index at Item 15(a)(2) (collectively referred to as the "financial statements"). In our opinion, the financial statements present fairly, in all material respects, the financial position of the Company as of December 31, 2024 and 2023, and the results of its operations and its cash flows for each of the three years in the period ended December 31, 2024, in conformity with accounting principles generally accepted in the United States of America.
We have also audited, in accordance with the standards of the Public Company Accounting Oversight Board (United States) (PCAOB), the Company's internal control over financial reporting as of December 31, 2024, based on criteria established in Internal Control — Integrated Framework (2013) issued by the Committee of Sponsoring Organizations of the Treadway Commission and our report dated February 19, 2025, expressed an unqualified opinion on the Company's internal control over financial reporting.
Basis for Opinion
These financial statements are the responsibility of the Company's management. Our responsibility is to express an opinion on the Company's financial statements based on our audits. We are a public accounting firm registered with the PCAOB and are required to be independent with respect to the Company in accordance with the U.S. federal securities laws and the applicable rules and regulations of the Securities and Exchange Commission and the PCAOB.
We conducted our audits in accordance with the standards of the PCAOB. Those standards require that we plan and perform the audit to obtain reasonable assurance about whether the financial statements are free of material misstatement, whether due to error or fraud. Our audits included performing procedures to assess the risks of material misstatement of the financial statements, whether due to error or fraud, and performing procedures that respond to those risks. Such procedures included examining, on a test basis, evidence regarding the amounts and disclosures in the financial statements. Our audits also included evaluating the accounting principles used and significant estimates made by management, as well as evaluating the overall presentation of the financial statements. We believe that our audits provide a reasonable basis for our opinion.
Critical Audit Matter
The critical audit matter communicated below is a matter arising from the current-period audit of the financial statements that was communicated or required to be communicated to the audit committee and that (1) relates to accounts or disclosures that are material to the financial statements and (2) involved our especially challenging, subjective, or complex judgments. The communication of critical audit matters does not alter in any way our opinion on the financial statements, taken as a whole, and we are not, by communicating the critical audit matter below, providing a separate opinion on the critical audit matter or on the accounts or disclosures to which it relates.
Goodwill – Certain Reporting Units - Refer to Notes 1 and 7 to the financial statements
Critical Audit Matter Description
The Company’s evaluation of goodwill for impairment involves the comparison of the estimated fair value of each reporting unit to its carrying value. The annual impairment test of goodwill at a reporting unit level is performed annually as of July 1, or more frequently if events or circumstances indicate the fair value of a reporting unit may be below its respective carrying value. The Company uses the income approach that estimates the fair value of the future discounted cash flows method. This method requires management to make significant estimates and assumptions related to discount rates, revenue growth rates, and operating unit profit margins for each reporting unit. Changes in these assumptions could have a significant impact on either the fair value, the amount of any goodwill impairment charge, or both.
47
Part II |
The three reporting units we identified as a critical audit matter are within North America and Europe, have fair values exceeding their carrying values as of the annual assessment, and represent $1,243.0 million of the consolidated Goodwill balance. Revenue growth rates, operating unit profit margins, and discount rates for these three reporting units are sensitive to significant and long-term deterioration in the macroeconomic environment, industry or market conditions. The goodwill for these three reporting units was identified as a critical audit matter considering the quantitative significance of recorded goodwill, the lower level of excess fair value, and the sensitivity of management’s estimates and assumptions to changes in the macroeconomic environment, industry or market conditions. Therefore, minor changes to the significant estimates and assumptions could result in an impairment. This required a high degree of auditor judgment and an increased extent of effort, including the need to involve professionals in our firm having expertise in valuation, when performing audit procedures to evaluate the reasonableness of management’s estimates and assumptions related to revenue growth rates, operating unit margins, and selection of the discount rates.
How the Critical Audit Matter Was Addressed in the Audit
Our audit procedures related to the revenue growth rates, operating unit profit margins, and the selection of discount rates for the three reporting units included the following, among others:
/s/ Deloitte & Touche LLP
Milwaukee, Wisconsin
February 19, 2025
We have served as the Company's auditor since 2005.
48
Part II |
CONSOLIDATED STATEMENTS OF OPERATIONS
in millions, except per share data
Year Ended December 31 |
|
2024 |
|
|
2023 |
|
|
2022 |
|
|||
|
|
|
|
|
|
|
|
|
|
|||
Revenues from services |
|
$ |
|
|
$ |
|
|
$ |
|
|||
Cost of services |
|
|
|
|
|
|
|
|
|
|||
Gross profit |
|
|
|
|
|
|
|
|
|
|||
Selling and administrative expenses, excluding goodwill impairment charges |
|
|
|
|
|
|
|
|
|
|||
Goodwill impairment charges |
|
|
|
|
|
|
|
|
|
|||
Selling and administrative expenses |
|
|
|
|
|
|
|
|
|
|||
Operating profit |
|
|
|
|
|
|
|
|
|
|||
Interest and other expenses, net |
|
|
|
|
|
|
|
|
|
|||
Earnings before income taxes |
|
|
|
|
|
|
|
|
|
|||
Provision for income taxes |
|
|
|
|
|
|
|
|
|
|||
Net earnings |
|
$ |
|
|
$ |
|
|
$ |
|
|||
Net earnings per share – basic |
|
$ |
|
|
$ |
|
|
$ |
|
|||
Net earnings per share – diluted |
|
$ |
|
|
$ |
|
|
$ |
|
|||
Weighted average shares – basic |
|
|
|
|
|
|
|
|
|
|||
Weighted average shares – diluted |
|
|
|
|
|
|
|
|
|
|||
The accompanying Notes to Consolidated Financial Statements are an integral part of these statements.
49
Part II |
CONSOLIDATED STATEMENTS OF COMPREHENSIVE INCOME
in millions
Year Ended December 31 |
|
2024 |
|
|
2023 |
|
|
2022 |
|
|||
|
|
|
|
|
|
|
|
|
|
|||
Net earnings |
|
$ |
|
|
$ |
|
|
$ |
|
|||
Other comprehensive income (loss): |
|
|
|
|
|
|
|
|
|
|||
Foreign currency translation |
|
|
( |
) |
|
|
|
|
|
( |
) |
|
Translation adjustments on long-term intercompany loans, net of income |
|
|
|
|
|
( |
) |
|
|
|
||
Adjustments on derivative instruments, net of income taxes of $ |
|
|
|
|
|
( |
) |
|
|
|
||
Unrealized adjustments on interest rate swap, net of income taxes of |
|
|
( |
) |
|
|
( |
) |
|
|
|
|
Defined benefit pension plans and retiree health care plan, net of income |
|
|
|
|
|
( |
) |
|
|
|
||
Pension settlements, net of income taxes of $ |
|
|
|
|
|
|
|
|
|
|||
Total other comprehensive income (loss) |
|
$ |
|
|
$ |
( |
) |
|
$ |
( |
) |
|
Comprehensive income |
|
$ |
|
|
$ |
|
|
$ |
|
|||
The accompanying Notes to Consolidated Financial Statements are an integral part of these statements.
50
Part II |
CONSOLIDATED BALANCE SHEETS
in millions, except share and per share data
December 31 |
|
2024 |
|
|
2023 |
|
||
|
|
|
|
|
|
|
||
ASSETS |
|
|
|
|
|
|
||
Current Assets |
|
|
|
|
|
|
||
Cash and cash equivalents |
|
$ |
|
|
$ |
|
||
Accounts receivable, less allowance for expected credit losses of $ |
|
|
|
|
|
|
||
Prepaid expenses and other assets |
|
|
|
|
|
|
||
Total current assets |
|
|
|
|
|
|
||
Other Assets |
|
|
|
|
|
|
||
Goodwill |
|
|
|
|
|
|
||
Intangible assets, less accumulated amortization of $ |
|
|
|
|
|
|
||
Operating lease right-of-use assets |
|
|
|
|
|
|
||
Other assets |
|
|
|
|
|
|
||
Total other assets |
|
|
|
|
|
|
||
Property and Equipment |
|
|
|
|
|
|
||
Land, buildings, leasehold improvements and equipment |
|
|
|
|
|
|
||
Less: accumulated depreciation and amortization |
|
|
|
|
|
|
||
Net property and equipment |
|
|
|
|
|
|
||
Total assets |
|
$ |
|
|
$ |
|
||
LIABILITIES AND SHAREHOLDERS' EQUITY |
|
|
|
|
|
|
||
Current Liabilities |
|
|
|
|
|
|
||
Accounts payable |
|
$ |
|
|
$ |
|
||
Employee compensation payable |
|
|
|
|
|
|
||
Accrued liabilities |
|
|
|
|
|
|
||
Accrued payroll taxes and insurance |
|
|
|
|
|
|
||
Value added taxes payable |
|
|
|
|
|
|
||
Short-term borrowings and current maturities of long-term debt |
|
|
|
|
|
|
||
Total current liabilities |
|
|
|
|
|
|
||
Other liabilities |
|
|
|
|
|
|
||
Long-term debt |
|
|
|
|
|
|
||
Long-term operating lease liability |
|
|
|
|
|
|
||
Other long-term liabilities |
|
|
|
|
|
|
||
Total other liabilities |
|
|
|
|
|
|
||
(Note 15) |
|
|
|
|
|
|
||
Shareholders’ Equity |
|
|
|
|
|
|
||
Preferred stock, $ |
|
|
|
|
|
|
||
Common stock, $ |
|
|
|
|
|
|
||
Capital in excess of par value |
|
|
|
|
|
|
||
Retained earnings |
|
|
|
|
|
|
||
Accumulated other comprehensive loss |
|
|
( |
) |
|
|
( |
) |
Treasury stock at cost, |
|
|
( |
) |
|
|
( |
) |
Total ManpowerGroup shareholders' equity |
|
|
|
|
|
|
||
Noncontrolling interests |
|
|
|
|
|
|
||
Total shareholders’ equity |
|
|
|
|
|
|
||
Total liabilities and shareholders’ equity |
|
$ |
|
|
$ |
|
||
The accompanying Notes to Consolidated Financial Statements are an integral part of these statements.
51
Part II |
CONSOLIDATED STATEMENTS OF CASH FLOWS
in millions
Year Ended December 31 |
|
2024 |
|
|
2023 |
|
|
2022 |
|
|||
|
|
|
|
|
|
|
|
|
|
|||
Cash Flows from Operating Activities |
|
|
|
|
|
|
|
|
|
|||
Net earnings |
|
$ |
|
|
$ |
|
|
$ |
|
|||
Adjustments to reconcile net earnings to net cash provided by operating activities: |
|
|
|
|
|
|
|
|
|
|||
Depreciation and amortization |
|
|
|
|
|
|
|
|
|
|||
Loss on sales of subsidiaries, net |
|
|
|
|
|
|
|
|
|
|||
Non-cash goodwill and other impairment charges |
|
|
|
|
|
|
|
|
|
|||
Deferred income taxes |
|
|
( |
) |
|
|
( |
) |
|
|
|
|
Allowance for expected credit losses |
|
|
|
|
|
|
|
|
|
|||
Share-based compensation |
|
|
|
|
|
|
|
|
|
|||
Change in operating assets and liabilities: |
|
|
|
|
|
|
|
|
|
|||
Accounts receivable |
|
|
|
|
|
|
|
|
|
|||
Other assets |
|
|
( |
) |
|
|
( |
) |
|
|
|
|
Accounts payable |
|
|
|
|
|
( |
) |
|
|
( |
) |
|
Other liabilities |
|
|
( |
) |
|
|
( |
) |
|
|
( |
) |
Cash provided by operating activities |
|
|
|
|
|
|
|
|
|
|||
Cash Flows from Investing Activities |
|
|
|
|
|
|
|
|
|
|||
Capital expenditures |
|
|
( |
) |
|
|
( |
) |
|
|
( |
) |
Acquisitions of businesses, net of cash acquired |
|
|
( |
) |
|
|
|
|
|
( |
) |
|
Impact to cash resulting from sales of subsidiaries |
|
|
( |
) |
|
|
|
|
|
|
||
Proceeds from the sale of subsidiaries and property and equipment |
|
|
|
|
|
|
|
|
|
|||
Cash used in investing activities |
|
|
( |
) |
|
|
( |
) |
|
|
( |
) |
Cash Flows from Financing Activities |
|
|
|
|
|
|
|
|
|
|||
Net change in short-term borrowings |
|
|
|
|
|
( |
) |
|
|
|
||
Net repayments of revolving debt facility |
|
|
|
|
|
|
|
|
( |
) |
||
Proceeds from long-term debt |
|
|
|
|
|
|
|
|
|
|||
Repayments of long-term debt |
|
|
( |
) |
|
|
( |
) |
|
|
( |
) |
Payments for debt issuance costs |
|
|
|
|
|
|
|
|
( |
) |
||
Proceeds from derivative settlement |
|
|
|
|
|
|
|
|
|
|||
Payments of contingent consideration for acquisitions |
|
|
( |
) |
|
|
|
|
|
( |
) |
|
Proceeds from share-based awards |
|
|
|
|
|
|
|
|
|
|||
Payments to noncontrolling interests |
|
|
( |
) |
|
|
( |
) |
|
|
( |
) |
Other share-based award transactions |
|
|
( |
) |
|
|
( |
) |
|
|
( |
) |
Repurchases of common stock |
|
|
( |
) |
|
|
( |
) |
|
|
( |
) |
Dividends paid |
|
|
( |
) |
|
|
( |
) |
|
|
( |
) |
Cash used in financing activities |
|
|
( |
) |
|
|
( |
) |
|
|
( |
) |
Effect of exchange rate changes on cash |
|
|
( |
) |
|
|
|
|
|
( |
) |
|
Change in cash and cash equivalents |
|
|
( |
) |
|
|
( |
) |
|
|
( |
) |
Cash and cash equivalents, beginning of year |
|
|
|
|
|
|
|
|
|
|||
Cash and cash equivalents, end of year |
|
$ |
|
|
$ |
|
|
$ |
|
|||
Supplemental Cash Flow Information |
|
|
|
|
|
|
|
|
|
|||
Cash paid during the period for: |
|
|
|
|
|
|
|
|
|
|||
Interest |
|
$ |
|
|
$ |
|
|
$ |
|
|||
Income taxes, net |
|
$ |
|
|
$ |
|
|
$ |
|
|||
Operating lease liabilities |
|
$ |
|
|
$ |
|
|
$ |
|
|||
Non-cash operating activity: |
|
|
|
|
|
|
|
|
|
|||
Right-of-use assets obtained in exchange for new operating lease liabilities |
|
$ |
|
|
$ |
|
|
$ |
|
|||
The accompanying Notes to Consolidated Financial Statements are an integral part of these statements.
52
Part II |
in millions, except share and per share data
|
|
ManpowerGroup Shareholders |
|
|
|
|
|
|
|
|||||||||||||||||||||||
|
|
|
|
|
|
|
|
|
|
|
|
|
|
|
|
|
|
|
|
|
|
|
|
|
||||||||
|
|
Common Stock |
|
|
|
|
|
|
|
|
|
|
|
|
|
|
|
|
|
|
|
|||||||||||
|
|
|
|
|
|
|
|
|
|
|
|
|
|
|
|
|
|
|
|
|
|
|
|
|
||||||||
|
|
Shares |
|
|
Par |
|
|
Capital in |
|
|
Retained |
|
|
Accumulated Other |
|
|
Treasury |
|
|
Non- |
|
|
Total |
|
||||||||
|
|
|
|
|
|
|
|
|
|
|
|
|
|
|
|
|
|
|
|
|
|
|
|
|
||||||||
Balance, December 31, 2021 |
|
|
|
|
$ |
|
|
$ |
|
|
$ |
|
|
$ |
( |
) |
|
$ |
( |
) |
|
$ |
|
|
$ |
|
||||||
Net earnings |
|
|
|
|
|
|
|
|
|
|
|
|
|
|
|
|
|
|
|
|
|
|
|
|
||||||||
Other comprehensive loss |
|
|
|
|
|
|
|
|
|
|
|
|
|
|
( |
) |
|
|
|
|
|
|
|
|
( |
) |
||||||
Issuances under equity plans |
|
|
|
|
|
|
|
|
|
|
|
|
|
|
|
|
|
( |
) |
|
|
|
|
|
( |
) |
||||||
Share-based compensation expense |
|
|
|
|
|
|
|
|
|
|
|
|
|
|
|
|
|
|
|
|
|
|
|
|
||||||||
Dividends ($ |
|
|
|
|
|
|
|
|
|
|
|
( |
) |
|
|
|
|
|
|
|
|
|
|
|
( |
) |
||||||
Repurchases of common stock |
|
|
|
|
|
|
|
|
|
|
|
|
|
|
|
|
|
( |
) |
|
|
|
|
|
( |
) |
||||||
Noncontrolling interest transactions |
|
|
|
|
|
|
|
|
|
|
|
|
|
|
|
|
|
|
|
|
|
|
|
|
||||||||
Balance, December 31, 2022 |
|
|
|
|
$ |
|
|
$ |
|
|
$ |
|
|
$ |
( |
) |
|
$ |
( |
) |
|
$ |
|
|
$ |
|
||||||
Net earnings |
|
|
|
|
|
|
|
|
|
|
|
|
|
|
|
|
|
|
|
|
|
|
|
|
||||||||
Other comprehensive loss |
|
|
|
|
|
|
|
|
|
|
|
|
|
|
( |
) |
|
|
|
|
|
|
|
|
( |
) |
||||||
Issuances under equity plans |
|
|
|
|
|
|
|
|
|
|
|
|
|
|
|
|
|
( |
) |
|
|
|
|
|
( |
) |
||||||
Share-based compensation expense |
|
|
|
|
|
|
|
|
|
|
|
|
|
|
|
|
|
|
|
|
|
|
|
|
||||||||
Dividends ($ |
|
|
|
|
|
|
|
|
|
|
|
( |
) |
|
|
|
|
|
|
|
|
|
|
|
( |
) |
||||||
Repurchases of common stock, including |
|
|
|
|
|
|
|
|
|
|
|
|
|
|
|
|
|
( |
) |
|
|
|
|
|
( |
) |
||||||
Balance, December 31, 2023 |
|
|
|
|
$ |
|
|
$ |
|
|
$ |
|
|
$ |
( |
) |
|
$ |
( |
) |
|
$ |
|
|
$ |
|
||||||
Net earnings |
|
|
|
|
|
|
|
|
|
|
|
|
|
|
|
|
|
|
|
|
|
|
|
|
||||||||
Other comprehensive income |
|
|
|
|
|
|
|
|
|
|
|
|
|
|
|
|
|
|
|
|
|
|
|
|
||||||||
Issuances under equity plans |
|
|
|
|
|
|
|
|
|
|
|
|
|
|
|
|
|
( |
) |
|
|
|
|
|
( |
) |
||||||
Share-based compensation expense |
|
|
|
|
|
|
|
|
|
|
|
|
|
|
|
|
|
|
|
|
|
|
|
|
||||||||
Dividends ($ |
|
|
|
|
|
|
|
|
|
|
|
( |
) |
|
|
|
|
|
|
|
|
|
|
|
( |
) |
||||||
Repurchases of common stock, including |
|
|
|
|
|
|
|
|
|
|
|
|
|
|
|
|
|
( |
) |
|
|
|
|
|
( |
) |
||||||
Noncontrolling interest transactions |
|
|
|
|
|
|
|
|
|
|
|
|
|
|
|
|
|
|
|
|
( |
) |
|
|
( |
) |
||||||
Balance, December 31, 2024 |
|
|
|
|
$ |
|
|
$ |
|
|
$ |
|
|
$ |
( |
) |
|
$ |
( |
) |
|
$ |
|
|
$ |
|
||||||
The accompanying Notes to Consolidated Financial Statements are an integral part of these statements.
53
Part II |
NOTES TO CONSOLIDATED FINANCIAL STATEMENTS
in millions, except share and per share data
Nature of Operations
Use of Estimates
The preparation of financial statements in conformity with accounting principles generally accepted in the United States requires us to make estimates and assumptions that affect the reported amounts of assets and liabilities and disclosure of contingent assets and liabilities at the date of the financial statements and the reported amounts of revenues and expenses for the reporting period. Estimates are used for, but not limited to, the accounting for the allowance for doubtful accounts and credit losses, defined benefit plans, workers’ compensation, share-based compensation, annual performance-related incentives, leases, goodwill and long-lived asset impairment, valuation of acquired intangibles and income taxes. Actual results could differ from these estimates.
Basis of Consolidation
Reclassification
Certain amounts within cash provided by operating activities on the Consolidated Statements of Cash Flows have been reclassified to conform to current year presentation. Accounts payable has been separated from other liabilities and is now separately disclosed on the Consolidated Statements of Cash Flows.
Revenues
We recognize revenues when or as control of the promised services is transferred to our clients, in an amount that reflects the consideration we expect to be entitled to receive in exchange for those services. Our revenues are recorded net of any sales, value added or other taxes collected from our clients.
54
Part II |
A performance obligation is a promise in a contract to transfer a distinct service to the client, and it is the unit of account in the accounting guidance for revenue recognition. The majority of our contracts have a single performance obligation as the promise to transfer the individual services is not separately identifiable from other promises in our contracts and, therefore, is not distinct. However, we have multiple performance obligations within our Recruitment Process Outsourcing (RPO) contracts as discussed below. For performance obligations that we satisfy over time, revenues are recognized by consistently applying a method of measuring progress toward satisfaction of that performance obligation. We generally utilize an input measure of time (e.g., hours, weeks, months) of service provided, which most accurately depicts the progress toward completion of each performance obligation.
We generally determine standalone selling prices based on the prices included in the client contracts, using expected costs plus margin or other observable prices. The price as specified in our client contracts is generally considered the standalone selling price as it is an observable input that depicts the price as if separately sold to a similar client in similar circumstances. Certain client contracts have variable consideration, including credits, sales allowances, rebates or other similar items that generally reduce the transaction price. We estimate variable consideration using whichever method, either the expected value method or most likely amount method, better predicts the amount of consideration to which we will become entitled based on the terms of the client contract and historical evidence. These amounts may be constrained and are only included in revenues to the extent we do not expect a significant reversal when the uncertainty associated with the variable consideration is resolved. Our variable consideration amounts are not material, and we do not believe that there will be significant changes to our estimates.
Our client contracts generally include standard payment terms acceptable in each of the countries and territories in which we operate. The payment terms vary by the type and location of our clients and services offered. Client payments are typically due approximately
In certain scenarios where a third-party vendor is involved in our revenue transactions with our clients, we evaluate whether we are the principal or the agent in the transaction. In situations where we act as principal in the transaction, we control the performance obligation prior to transfer to the client, and we report the related amounts as gross revenues and cost of services. When we act as agent in the transaction, we do not control the performance obligation prior to transfer to the client, and we report the related amounts as revenues on a net basis.
A majority of these agent transactions occur within our TAPFIN - Managed Service Provider (MSP) programs where our performance obligation is to manage our client’s contingent workforce, and we earn a commission based on the amount of staffing services that are managed through the program. We are the agent in these transactions as we do not control the third-party providers' staffing services provided to the client through our MSP program prior to those services being transferred to the client.
For certain client contracts where we recognize revenues over time, we recognize the amount that we have the right to invoice, which corresponds directly to the value provided to the client of our performance to date.
As allowed under the guidance, we do not disclose the amount of unsatisfied performance obligations for client contracts with an original expected length of one year or less and those client contracts for which we recognize revenues at the amount to which we have the right to invoice for services performed. We have other contracts with revenues expected to be recognized subsequent to December 31, 2024 related to remaining performance obligations, which are not material.
Accounts Receivable, Contract Assets and Contract Liabilities
We record accounts receivable when our right to consideration becomes unconditional. Contract assets primarily relate to our rights to consideration for services provided that they are conditional on satisfaction of future performance obligations. We record contract liabilities (deferred revenue) when payments are made or due prior to the related performance obligations being satisfied. The current portion of our contract liabilities is included in accrued liabilities in our Consolidated Balance Sheets. We do not have any material contract assets or long-term contract liabilities.
Our deferred revenue was $
55
Part II |
Allowance for Expected Credit Losses
We have an allowance for expected credit losses recorded as an estimate of the accounts receivable balance that may not be collected. This allowance is calculated on an entity-by-entity basis with consideration for historical write-off experience, age of receivables, market conditions, and a specific review for expected credit losses. Items that affect this balance mainly include provision for expected credit losses and the write-off of accounts receivable balances.
Changes in allowance for expected credit losses are as follows:
|
|
Balance at |
|
Bad Debt Expense |
|
Write-Offs |
|
Translation |
|
Reclassifications |
|
Balance |
||||||||||||||||||
|
|
|
|
|
|
|
|
|
|
|
|
|
|
|
|
|
|
|
|
|
|
|
|
|
||||||
2024 |
|
$ |
|
|
|
$ |
|
|
|
$ |
( |
) |
(a) |
|
$ |
( |
) |
|
|
$ |
|
|
|
$ |
|
|
||||
2023 |
|
|
|
|
|
|
|
|
|
|
( |
) |
|
|
|
|
|
|
|
|
|
|
|
|
|
|||||
2022 |
|
|
|
|
|
|
|
|
|
|
( |
) |
|
|
|
( |
) |
|
|
|
( |
) |
|
|
|
|
|
|||
Bad debt expense is recorded as selling and administrative expenses in our Consolidated Statements of Operations. Factors that would cause this provision to increase primarily relate to increased bankruptcies by our clients and other difficulties collecting amounts billed. On the other hand, an improved write-off experience and aging of receivables would result in a decrease to the provision.
Advertising Costs
We expense production costs of advertising as they are incurred. Advertising expenses were $
Restructuring Costs
We recorded net restructuring costs of $
Changes in the restructuring reserve by reportable segment and Corporate are shown below:
|
|
Americas(a) |
|
|
Southern |
|
|
Northern |
|
|
APME |
|
|
Corporate |
|
|
Total |
|
||||||
|
|
|
|
|
|
|
|
|
|
|
|
|
|
|
|
|
|
|
||||||
Balance, December 31, 2022 |
|
$ |
|
|
$ |
|
|
$ |
|
|
$ |
|
|
$ |
|
|
|
|
||||||
Severance costs |
|
|
|
|
|
|
|
|
|
|
|
|
|
|
|
|
|
|
||||||
Other costs |
|
|
|
|
|
|
|
|
|
|
|
|
|
|
|
|
|
|
||||||
Costs paid |
|
|
( |
) |
|
|
( |
) |
|
|
( |
) |
|
|
( |
) |
|
|
( |
) |
|
|
( |
) |
Balance, December 31, 2023 |
|
$ |
|
|
$ |
|
|
$ |
|
|
$ |
|
|
$ |
|
|
$ |
|
||||||
Severance costs |
|
|
|
|
|
|
|
|
|
|
|
|
|
|
|
|
|
|
||||||
Lease costs(c) |
|
|
|
|
|
|
|
|
|
|
|
|
|
|
|
|
|
|
||||||
Other costs |
|
|
|
|
|
|
|
|
|
|
|
|
|
|
|
|
|
|
||||||
Non-cash charges |
|
|
( |
) |
|
|
( |
) |
|
|
( |
) |
|
|
|
|
|
|
|
|
( |
) |
||
Costs paid |
|
|
( |
) |
|
|
( |
) |
|
|
( |
) |
|
|
( |
) |
|
|
|
|
|
( |
) |
|
Balance, December 31, 2024 |
|
$ |
|
|
$ |
|
|
$ |
|
|
$ |
|
|
$ |
|
|
$ |
|
||||||
56
Part II |
Income Taxes
Deferred tax assets and liabilities are recognized for the future tax consequences attributable to differences between financial statement carrying amounts of existing assets and liabilities and their respective tax basis, and net operating loss and tax credit carryforwards. Deferred tax assets and liabilities are measured using enacted tax rates expected to apply to taxable income in the years in which those temporary differences are expected to be recovered or settled. We record a valuation allowance against deferred tax assets to reduce the assets to the amounts more likely than not to be realized.
Fair Value Measurements
The assets and liabilities measured and recorded at fair value on a recurring basis were as follows:
|
|
Fair Value Measurements Using |
|
|
Fair Value Measurements Using |
|
||||||||||||||||||||||||||
|
|
|
|
|
|
|
|
|
|
|
|
|
|
|
|
|
|
|
|
|
|
|
|
|
||||||||
|
|
|
|
|
|
|
|
|
|
|
|
|
|
|
|
|
|
|
|
|
|
|
|
|
||||||||
|
|
December 31, 2024 |
|
|
Quoted |
|
|
Significant |
|
|
Significant |
|
|
December 31, 2023 |
|
|
Quoted |
|
|
Significant |
|
|
Significant |
|
||||||||
|
|
|
|
|
|
|
|
|
|
|
|
|
|
|
|
|
|
|
|
|
|
|
|
|
||||||||
Assets |
|
|
|
|
|
|
|
|
|
|
|
|
|
|
|
|
|
|
|
|
|
|
|
|
||||||||
Deferred compensation plan assets |
|
$ |
|
|
$ |
|
|
$ |
|
|
$ |
|
|
$ |
|
|
$ |
|
|
$ |
|
|
$ |
|
||||||||
Cross-currency swaps |
|
|
|
|
|
|
|
|
|
|
|
|
|
|
|
|
|
|
|
|
|
|
|
|
||||||||
Foreign currency forward contracts |
|
|
|
|
|
|
|
|
|
|
|
|
|
|
|
|
|
|
|
|
|
|
|
|
||||||||
|
|
$ |
|
|
$ |
|
|
$ |
|
|
$ |
|
|
$ |
|
|
$ |
|
|
$ |
|
|
$ |
|
||||||||
Liabilities |
|
|
|
|
|
|
|
|
|
|
|
|
|
|
|
|
|
|
|
|
|
|
|
|
||||||||
Cross-currency swaps |
|
$ |
|
|
$ |
|
|
$ |
|
|
$ |
|
|
$ |
|
|
$ |
|
|
$ |
|
|
$ |
|
||||||||
Foreign currency forward contracts |
|
|
|
|
|
|
|
|
|
|
|
|
|
|
|
|
|
|
|
|
|
|
|
|
||||||||
|
|
$ |
|
|
$ |
|
|
$ |
|
|
$ |
|
|
$ |
|
|
$ |
|
|
$ |
|
|
$ |
|
||||||||
The carrying values of cash and cash equivalents, accounts receivable, accounts payable and other current assets and liabilities approximate their fair values because of the short-term nature of these instruments. The carrying value of our variable-rate long-term debt and revolving debt facility approximates fair value. The fair value of the Euro-denominated notes, as observable at commonly quoted intervals (Level 2 inputs), was $
57
Part II |
Goodwill and Other Intangible Assets
We had goodwill, finite-lived intangible assets and indefinite-lived intangible assets as follows:
|
|
December 31, 2024 |
|
|
December 31, 2023 |
|
||||||||||||||||||
|
|
|
|
|
|
|
|
|
|
|
|
|
|
|
|
|
|
|
||||||
|
|
|
|
|
|
|
|
|
|
|
|
|
|
|
|
|
|
|
||||||
|
|
Gross |
|
|
Accumulated |
|
|
Net |
|
|
Gross |
|
|
Accumulated |
|
|
Net |
|
||||||
|
|
|
|
|
|
|
|
|
|
|
|
|
|
|
|
|
|
|
||||||
Goodwill(a) |
|
$ |
|
|
$ |
— |
|
|
$ |
|
|
$ |
|
|
$ |
— |
|
|
$ |
|
||||
Intangible assets: |
|
|
|
|
|
|
|
|
|
|
|
|
|
|
|
|
|
|
||||||
Finite-lived: |
|
|
|
|
|
|
|
|
|
|
|
|
|
|
|
|
|
|
||||||
Customer relationships |
|
$ |
|
|
$ |
|
|
$ |
|
|
$ |
|
|
$ |
|
|
$ |
|
||||||
Other |
|
|
|
|
|
|
|
|
|
|
|
|
|
|
|
|
$ |
|
||||||
|
|
|
|
|
|
|
|
|
|
|
|
|
|
|
|
|
|
|
||||||
Indefinite-lived: |
|
|
|
|
|
|
|
|
|
|
|
|
|
|
|
|
|
|
||||||
Tradenames(b) |
|
|
|
|
|
— |
|
|
|
|
|
|
|
|
|
— |
|
|
|
|
||||
Reacquired franchise rights |
|
|
|
|
|
— |
|
|
|
|
|
|
|
|
|
— |
|
|
|
|
||||
|
|
|
|
|
|
— |
|
|
|
|
|
|
|
|
|
— |
|
|
|
|
||||
Total intangible assets |
|
$ |
|
|
$ |
|
|
$ |
|
|
$ |
|
|
$ |
|
|
$ |
|
||||||
The consolidated amortization expense related to intangibles was $
In accordance with the accounting guidance on goodwill and other intangible assets, we perform an annual impairment test of goodwill at our reporting unit level and indefinite-lived intangible assets at our unit of account level during the third quarter, or more frequently if events or circumstances change that would more likely than not reduce the fair value of our reporting units below their carrying value. In the event the fair value of a reporting unit is less than the carrying value, including goodwill, we would record an impairment charge based on the excess of a reporting units’ carrying amount over its fair value.
We evaluate the recoverability of goodwill utilizing an income approach that estimates the fair value of the future discounted cash flows to which the goodwill relates. This approach reflects management’s outlook of the reporting units, which is believed to be the best determination of value due to management’s insight and experience with the reporting units. Significant assumptions used in our goodwill impairment tests include: expected future revenue growth rates, operating unit profit margins, working capital levels, discount rates, and terminal value multiple. The expected future revenue growth rates and operating unit profit margins are determined after taking into consideration our historical revenue growth rates and operating unit profit margins, our assessment of future market potential and our expectations of future business performance. We believe that the future discounted cash flow valuation model provides the most reasonable and meaningful fair value estimate based on the reporting units’ projections of future operating results and cash flows and is consistent with our view of how market participants would value the company’s reporting units in an orderly transaction.
58
Part II |
We performed our annual impairment test of our goodwill and indefinite-lived intangible assets during the third quarter of 2024, and determined that there was
While the excess of fair value over carrying amount exceeded
During the fourth quarter of 2024, in connection with the preparation of our annual financial statements, we assessed the changes in circumstances that occurred during the quarter to determine if it was more likely than not that the fair value of any reporting unit or indefinite-lived intangible asset were below its carrying amount. While we continued to see challenging market conditions in Europe which led to lower levels of revenue and OUP in certain of our reporting units than we had forecasted at the time of our impairment testing, we concluded based on our analysis performed, that the fair value of these reporting units continued to exceed the carrying value and did not identify a triggering event.
There could be significant further decreases in the operating results of our reporting units for a sustained period, which may result in a recognition of goodwill impairment that could be material to the Consolidated Financial Statements.
Capitalized Software for Internal Use
We capitalize purchased software as well as internally developed software. Internal software development costs are capitalized from the time when the internal-use software is considered probable of completion until the software is ready for use. Business analysis, system evaluation, selection and software maintenance costs are expensed as incurred. Capitalized software costs are amortized using the straight-line method over the estimated useful life of the software which ranges from
Cloud Computing Arrangements
We utilize cloud computing arrangements such as hosting arrangements that are service contracts, whereby we gain remote access to use software hosted by the vendor or another third party on an as-needed basis for a period of time in exchange for a subscription fee. Subscription fees are usually prepaid and recorded in selling and administrative expenses over the related subscription period. Certain implementation costs for cloud computing arrangements are capitalized in prepaid expenses or other noncurrent assets if they consist of internal and external costs directly attributable to developing and configuring cloud computing software for its intended use. Amortization of capitalized implementation costs is recorded in selling and administrative expenses on a straight-line basis over the term of the cloud computing arrangement, which is the non-cancellable period of agreement, together with periods covered by renewal options that we are reasonably certain to exercise. The unamortized implementation costs related to our cloud computing arrangements were $
59
Part II |
Property and Equipment
A summary of property and equipment as of December 31 is as follows:
|
|
2024 |
|
|
2023 |
|
||
|
|
|
|
|
|
|
||
Land |
|
$ |
|
|
$ |
|
||
Buildings |
|
|
|
|
|
|
||
Furniture, fixtures, and autos |
|
|
|
|
|
|
||
Computer equipment |
|
|
|
|
|
|
||
Leasehold improvements |
|
|
|
|
|
|
||
Property and equipment |
|
$ |
|
|
$ |
|
||
Property and equipment are stated at cost and are depreciated using primarily the straight-line method over the following estimated useful lives: buildings - up to
Leases
We recognize right-of-use assets (“ROU”) and lease liabilities on the balance sheet for leases with lease terms longer than 12 months and we classify the lease as a finance or operating lease which affects the recognition, measurement, and presentation of lease expenses and cash flows.
We have operating leases for real estate, vehicles, and equipment. Our leases have remaining lease terms of
Some leasing arrangements require variable payments that are dependent on usage or may vary for other reasons, such as payments for insurance and tax payments. The variable portion of lease payments is not included in our ROU assets or lease liabilities. Rather, variable payments, other than those dependent upon an index or rate, are expensed when the obligation for those payments is incurred and are included in lease expenses recorded in selling and administrative expenses on the Consolidated Statements of Operations.
We have lease agreements with both lease and non-lease components that are treated as a single lease component for all underlying asset classes. Accordingly, all expenses associated with a lease contract are accounted for as lease expenses.
Derivative Financial Instruments
Derivative instruments are recorded on the balance sheet as either an asset or liability measured at their fair value. If the derivative is designated as a fair value hedge, the changes in the fair value of the derivative and of the hedged item attributable to the hedged risk are recognized in earnings. If the derivative is designated as a cash flow hedge, the effective portions of the changes in the fair value of the derivative are recorded as a component of accumulated other comprehensive loss and recognized in the Consolidated Statements of Operations when the hedged item affects earnings. The ineffective portions of the changes in the fair value of cash flow hedges are recognized in earnings.
60
Part II |
Foreign Currency Translation
Asset and liability accounts are translated at the current exchange rates and income statement items are translated at the average exchange rates each month. The resulting translation adjustments are recorded as a component of accumulated other comprehensive loss, which is included in shareholders’ equity.
As of July 1, 2018, the Argentina economy was designated as highly-inflationary and was treated as such for accounting purposes for all periods presented.
A portion of our Euro-denominated notes is accounted for as a hedge of our net investment in our subsidiaries with a Euro-functional currency. For this portion of the Euro-denominated notes, since our net investment in these subsidiaries exceeds the amount of the related borrowings, net of tax, the related translation gains or losses are included as a component of accumulated other comprehensive loss.
Shareholders’ Equity
The Board of Directors authorized the repurchase of
During 2024, 2023 and 2022, the Board of Directors declared total cash dividends of $
Noncontrolling interests, included in total shareholders' equity in our Consolidated Balance Sheets, represent amounts related to majority-owned subsidiaries in which we have a controlling financial interest. Net earnings attributable to these noncontrolling interests are recorded in interest and other expenses in our Consolidated Statements of Operations. We recorded expenses of $
Cash and Cash Equivalents
Cash and cash equivalents comprise cash on hand, term deposits with banks and short-term highly-liquid financial investments that are readily convertible to known amounts of cash which are subject to insignificant risk of changes in value; and have a maturity of three months or less from the date of acquisition.
Accounting Standards Effective as of January 1, 2024
In November 2023, the FASB issued new guidance on segment reporting. The guidance requires an annual and interim disclosure of significant segment expenses that are (1) regularly provided to the chief operating decision maker and (2) included in the reported measure of segment profit or loss. The guidance also allows companies to disclose multiple measures of segment profit or loss if those measures are used to assess performance and allocate resources. We adopted the new guidance for our 2024 annual disclosures. See Note 14 to the Consolidated Financial Statements for more information.
Recently Issued Accounting Standards
In November 2024, the FASB issued new guidance on disaggregation of income statement expenses. The guidance requires disclosures about specific types of expenses included in the expense captions presented on the face of the income statement, as well as disclosures about selling expenses. The guidance is effective for our 2027 annual financial statements and can be adopted prospectively or retrospectively. We are currently assessing the impact of the adoption of this guidance on our financial statement disclosures.
In December 2023, the FASB issued a final standard on improvements to income tax disclosures. The guidance requires that public entities on an annual basis disclose disaggregated information about the rate reconciliation as well as income taxes paid. The new standard is effective for our 2025 annual disclosures and will be adopted prospectively. The adoption of this guidance will not have a material impact on our Consolidated Financial Statements.
61
Part II |
(2) Revenue Recognition
Revenue Service Types
The following is a description of our revenue service types, including Staffing and Interim, Outcome-Based Solutions and Consulting, Permanent Recruitment and Other services.
Staffing and Interim
Staffing and Interim services include the augmentation of clients’ workforce with our contingent employees performing services under the client’s supervision, which provides our clients with a source of flexible labor. Staffing and Interim client contracts are generally short-term in nature, and we generally enter into contracts that include only a single performance obligation. We recognize revenues over time based on a fixed amount for each hour of Staffing and Interim service provided as our clients benefit from our services as we provide them.
Outcome-Based Solutions and Consulting
Our Outcome-Based Solutions and Consulting services include utilizing consultants and contingent employees who are generally experts in a specific field advising the client to help find strategic solutions to specific matters or achieve a particular outcome. Our services may also include managing certain processes and functions within the client’s organization. We recognize revenues over time based on (i) our clients benefiting from our services as we are providing them, (ii) our clients controlling an asset as it is created or enhanced, or (iii) our performance not creating an asset with an alternative use and having an enforceable right to payment for the services we have provided to date. We generally utilize an input measure of time for the service provided, which most accurately depicts the progress toward completion of these performance obligations. The price as specified in our client contracts is generally considered the standalone selling price as it is an observable input that depicts the price as if sold to a similar client in similar circumstances.
Permanent Recruitment
Permanent Recruitment services include providing qualified candidates to our clients to hire on a permanent basis. We recognize revenues for our Permanent Recruitment services at a point in time when we place the qualified candidate, because we have determined that control of the performance obligation has transferred to the client (i.e., service performed) as we have the right to payment for our service and the client has accepted our service of providing a qualified candidate to fill a permanent position. Revenues recognized from our Permanent Recruitment services are based upon either a fixed fee per placement or as a percentage of the candidate’s salary.
Our RPO services, which include RPO management services and placement services, are also included in our Permanent Recruitment revenues. RPO management services include the various activities of managing a client's permanent workforce, which can include candidate assessments, screening, conducting candidate interviews, providing sourcing technology, and providing our marketing and recruiting expertise. We perform these activities to fulfill the overall obligation to provide permanent workforce management services, so they are not individually distinct, and therefore, we account for them as a single performance obligation. We generally utilize an input measure of time in months, but we do have a few contracts for which we use labor hours of management services provided as this more accurately depicts the progress toward completion of the performance obligation. We recognize revenues over time for each month of management services provided, as each month of management services is distinct, and the client benefits from each month of management services as we provide them. For those contracts for which we use labor hours as the input measure, we recognize revenues over time based on a fixed amount for each labor hour of management services provided as our clients benefit from our services as we provide them.
We consider the RPO management services and placement services to be distinct, and therefore separate performance obligations within our RPO contracts as (i) our clients can benefit from each service on its own, and (ii) each service is separately identifiable within the client contract. The prices as specified in our contracts will generally be broken out between management fees and placement fees, which we consider the standalone selling price of each service as they are the observable inputs which depict the prices as if they were sold to a similar client in similar circumstances. The consideration from our client contracts is allocated to each performance obligation based on the relative standalone selling price.
62
Part II |
Other Services
Other services include revenues from outplacement services, MSP services, training services and franchise fees.
Disaggregation of Revenues
In the following table, revenue is disaggregated by service types and timing of revenue recognition and then reconciled by reportable segment.
|
|
Year Ended December 31, |
|
|||||||||||||||||||||||||||||||||||||
|
|
|
|
|
|
|
|
|
|
|
|
|
|
|
|
|
|
|
|
|
|
|
|
|
|
|
|
|
|
|
||||||||||
|
|
2024 |
|
|
2023(a) |
|
||||||||||||||||||||||||||||||||||
|
|
|
|
|
|
|
|
|
|
|
|
|
|
|
|
|
|
|
|
|
|
|
|
|
|
|
|
|
|
|
||||||||||
|
|
Staffing |
|
|
Outcome- |
|
|
Permanent |
|
|
Other |
|
|
Total |
|
|
Staffing |
|
|
Outcome- |
|
|
Permanent |
|
|
Other |
|
|
Total |
|
||||||||||
|
|
|
|
|
|
|
|
|
|
|
|
|
|
|
|
|
|
|
|
|
|
|
|
|
|
|
|
|
|
|
||||||||||
Americas: |
|
|
|
|
|
|
|
|
|
|
|
|
|
|
|
|
|
|
|
|
|
|
|
|
|
|
|
|
|
|
||||||||||
United States |
|
$ |
|
|
$ |
|
|
$ |
|
|
$ |
|
|
$ |
|
|
$ |
|
|
$ |
|
|
$ |
|
|
$ |
|
|
$ |
|
||||||||||
Other Americas |
|
|
|
|
|
|
|
|
|
|
|
|
|
|
|
|
|
|
|
|
|
|
|
|
|
|
|
|
|
|
||||||||||
|
|
|
|
|
|
|
|
|
|
|
|
|
|
|
|
|
|
|
|
|
|
|
|
|
|
|
|
|
|
|
||||||||||
Southern Europe: |
|
|
|
|
|
|
|
|
|
|
|
|
|
|
|
|
|
|
|
|
|
|
|
|
|
|
|
|
|
|
||||||||||
France |
|
|
|
|
|
|
|
|
|
|
|
|
|
|
|
|
|
|
|
|
|
|
|
|
|
|
|
|
|
|
||||||||||
Italy |
|
|
|
|
|
|
|
|
|
|
|
|
|
|
|
|
|
|
|
|
|
|
|
|
|
|
|
|
|
|
||||||||||
Other Southern Europe |
|
|
|
|
|
|
|
|
|
|
|
|
|
|
|
|
|
|
|
|
|
|
|
|
|
|
|
|
|
|
||||||||||
|
|
|
|
|
|
|
|
|
|
|
|
|
|
|
|
|
|
|
|
|
|
|
|
|
|
|
|
|
|
|
||||||||||
Northern Europe |
|
|
|
|
|
|
|
|
|
|
|
|
|
|
|
|
|
|
|
|
|
|
|
|
|
|
|
|
|
|
||||||||||
APME |
|
|
|
|
|
|
|
|
|
|
|
|
|
|
|
|
|
|
|
|
|
|
|
|
|
|
|
|
|
|
||||||||||
|
|
|
|
|
|
|
|
|
|
|
|
|
|
|
|
|
|
|
|
|
|
|
|
|
|
|
|
|
|
|
||||||||||
Intercompany Eliminations |
|
|
|
|
|
|
|
|
|
|
|
|
|
|
( |
) |
|
|
|
|
|
|
|
|
|
|
|
|
|
|
( |
) |
||||||||
Total |
|
|
|
|
|
|
|
|
|
|
|
|
|
$ |
|
|
|
|
|
|
|
|
|
|
|
|
|
|
$ |
|
||||||||||
63
Part II |
|
|
Year Ended December 31, |
|
|||||||||||||||||||||
|
|
|
|
|
|
|
|
|
|
|
|
|
|
|
|
|
|
|
||||||
|
|
2024 |
|
|
2023(a) |
|
||||||||||||||||||
|
|
|
|
|
|
|
|
|
|
|
|
|
|
|
|
|
|
|
||||||
|
|
Services |
|
|
Services |
|
|
Total |
|
|
Services |
|
|
Services |
|
|
Total |
|
||||||
|
|
|
|
|
|
|
|
|
|
|
|
|
|
|
|
|
|
|
||||||
Americas: |
|
|
|
|
|
|
|
|
|
|
|
|
|
|
|
|
|
|
||||||
United States |
|
$ |
|
|
$ |
|
|
$ |
|
|
$ |
|
|
$ |
|
|
$ |
|
||||||
Other Americas |
|
|
|
|
|
|
|
|
|
|
|
|
|
|
|
|
|
|
||||||
|
|
|
|
|
|
|
|
|
|
|
|
|
|
|
|
|
|
|
||||||
Southern Europe: |
|
|
|
|
|
|
|
|
|
|
|
|
|
|
|
|
|
|
||||||
France |
|
|
|
|
|
|
|
|
|
|
|
|
|
|
|
|
|
|
||||||
Italy |
|
|
|
|
|
|
|
|
|
|
|
|
|
|
|
|
|
|
||||||
Other Southern Europe |
|
|
|
|
|
|
|
|
|
|
|
|
|
|
|
|
|
|
||||||
|
|
|
|
|
|
|
|
|
|
|
|
|
|
|
|
|
|
|
||||||
Northern Europe |
|
|
|
|
|
|
|
|
|
|
|
|
|
|
|
|
|
|
||||||
APME |
|
|
|
|
|
|
|
|
|
|
|
|
|
|
|
|
|
|
||||||
|
|
|
|
|
|
|
|
|
|
|
|
|
|
|
|
|
|
|
||||||
Intercompany Eliminations |
|
|
|
|
|
|
|
|
( |
) |
|
|
|
|
|
|
|
|
( |
) |
||||
Total |
|
|
|
|
|
|
|
$ |
|
|
|
|
|
|
|
|
$ |
|
||||||
64
Part II |
(3) Share-Based Compensation Plans
During 2024, 2023 and 2022, we recognized $
Stock Options and Stock Appreciation Rights
All share-based compensation is granted under the 2011 Equity Incentive Plan of ManpowerGroup Inc. (“2011 Plan”). Under the 2011 Plan, stock options and stock appreciation rights are required to be granted at a price not less than
|
|
Shares (000) |
|
|
Wtd. Avg. |
|
|
Wtd. Avg. |
|
|
Aggregate |
|
||||
|
|
|
|
|
|
|
|
|
|
|
|
|
||||
Outstanding, January 1, 2022 |
|
|
|
|
$ |
|
|
|
|
|
|
|
||||
Granted |
|
|
|
|
N/A |
|
|
|
|
|
|
|
||||
Exercised |
|
|
|
|
N/A |
|
|
|
|
|
|
|
||||
Expired or cancelled |
|
|
|
|
N/A |
|
|
|
|
|
|
|
||||
Outstanding, December 31, 2022 |
|
|
|
|
$ |
|
|
|
|
|
$ |
|
||||
Exercisable, December 31, 2022 |
|
|
|
|
$ |
|
|
|
|
|
$ |
|
||||
Outstanding, January 1, 2023 |
|
|
|
|
$ |
|
|
|
|
|
|
|
||||
Granted |
|
|
|
|
N/A |
|
|
|
|
|
|
|
||||
Exercised |
|
|
( |
) |
|
|
|
|
|
|
|
|
|
|||
Expired or cancelled |
|
|
( |
) |
|
|
|
|
|
|
|
|
|
|||
Outstanding, December 31, 2023 |
|
|
|
|
$ |
|
|
|
|
|
$ |
|
||||
Exercisable, December 31, 2023 |
|
|
|
|
$ |
|
|
|
|
|
$ |
|
||||
Outstanding, January 1, 2024 |
|
|
|
|
$ |
|
|
|
|
|
|
|
||||
Granted |
|
|
|
|
N/A |
|
|
|
|
|
|
|
||||
Exercised |
|
|
|
|
N/A |
|
|
|
|
|
|
|
||||
Expired or cancelled |
|
|
( |
) |
|
|
|
|
|
|
|
|
|
|||
Outstanding, December 31, 2024 |
|
|
|
|
$ |
|
|
|
|
|
$ |
|
||||
Exercisable, December 31, 2024 |
|
|
|
|
$ |
|
|
|
|
|
$ |
|
||||
Options outstanding and exercisable as of December 31, 2024 were as follows:
|
|
Options Outstanding |
|
|
Options Exercisable |
|
||||||||||||||
|
|
|
|
|
|
|
|
|
|
|
|
|
|
|
|
|||||
|
|
|
|
|
|
|
|
|
|
|
|
|
|
|
|
|||||
Exercise Price |
|
Shares (000) |
|
|
Weighted- |
|
|
Weighted- |
|
|
Shares (000) |
|
|
Weighted- |
|
|||||
|
|
|
|
|
|
|
|
|
|
|
|
|
|
|
|
|||||
$75-$80 |
|
|
|
|
|
|
|
$ |
|
|
|
|
|
$ |
|
|||||
$81-$89 |
|
|
|
|
|
|
|
|
|
|
|
|
|
|
|
|||||
$90-$95 |
|
|
|
|
|
|
|
|
|
|
|
|
|
|
|
|||||
$96-$123 |
|
|
|
|
|
|
|
|
|
|
|
|
|
|
|
|||||
|
|
|
|
|
|
|
|
$ |
|
|
|
|
|
$ |
|
|||||
We recognized expense of $
65
Part II |
Deferred Stock
Our non-employee directors may elect to receive deferred stock in lieu of part or all of their annual cash retainer otherwise payable to them. The number of shares of deferred stock is determined pursuant to a formula set forth in the terms and conditions adopted under the 2011 Plan; the deferred stock is settled in shares of common stock according to these terms and conditions. During December 31, 2024, 2023 and 2022, there were
Non-employee directors also receive an annual grant of deferred stock (or restricted stock, if they so elect) as additional compensation for board service. The award vests in equal quarterly installments over
Restricted Stock and Restricted Stock Units
We grant restricted stock and restricted stock unit awards to certain employees and to non-employee directors who may elect to receive restricted stock rather than deferred stock as described above. Restrictions lapse over periods ranging up to
A summary of restricted stock and restricted stock unit activity is as follows:
|
|
Shares (000) |
|
|
Wtd. Avg. |
|
|
Wtd. Avg. |
|
|
Aggregate |
|
||||
|
|
|
|
|
|
|
|
|
|
|
|
|
||||
Unvested, January 1, 2022 |
|
|
|
|
$ |
|
|
|
|
|
|
|
||||
Granted |
|
|
|
|
|
|
|
|
|
|
|
|
||||
Vested |
|
|
( |
) |
|
|
|
|
|
|
|
|
|
|||
Forfeited |
|
|
( |
) |
|
|
|
|
|
|
|
|
|
|||
Unvested, December 31, 2022 |
|
|
|
|
$ |
|
|
|
|
|
|
|
||||
Granted |
|
|
|
|
|
|
|
|
|
|
|
|
||||
Vested |
|
|
( |
) |
|
|
|
|
|
|
|
|
|
|||
Forfeited |
|
|
( |
) |
|
|
|
|
|
|
|
|
|
|||
Unvested, December 31, 2023 |
|
|
|
|
$ |
|
|
|
|
|
|
|
||||
Granted |
|
|
|
|
|
|
|
|
|
|
|
|
||||
Vested |
|
|
( |
) |
|
|
|
|
|
|
|
|
|
|||
Forfeited |
|
|
( |
) |
|
|
|
|
|
|
|
|
|
|||
Unvested, December 31, 2024 |
|
|
|
|
$ |
|
|
|
|
|
$ |
|
||||
During 2024, 2023 and 2022, there were
Performance Share Units
Our 2011 Plan allows us to grant performance share units. We grant performance share units with a performance period ranging from to
66
Part II |
In the event the performance criteria exceed the Target Award level, an additional number of shares, up to the Outstanding Award level, may be granted. In the event the performance criteria fall below the Target Award level, a reduced number of shares, as low as the Threshold Award level, may be granted. If the performance criteria fall below the Threshold Award level, no shares will be granted.
A summary of the performance share units detail by grant year is as follows:
|
|
2021 |
|
|
2021 |
|
|
2022 |
|
|
2022 |
|
|
2023 |
|
|
2024 |
|
||||||
|
|
|
|
|
|
|
|
|
|
|
|
|
|
|
|
|
|
|
||||||
Grant Date(s) |
|
February 12, |
|
|
February 12, |
|
|
February 11, |
|
|
February 11, |
|
|
February 17, |
|
|
February 16, |
|
||||||
Performance Period (years) |
|
2021 |
|
|
2021-2022 |
|
|
2022-2024 |
|
|
2022-2024 |
|
|
2023-2025 |
|
|
2024-2026 |
|
||||||
Vesting Date(1) |
|
February 2024 |
|
|
February 2023 |
|
|
February 2025 |
|
|
February 2025 |
|
|
February 2026 |
|
|
February 2027 |
|
||||||
Payout Levels (in units): |
|
|
|
|
|
|
|
|
|
|
|
|
|
|
|
|
|
|
||||||
Threshold Award |
|
|
|
|
|
|
|
|
|
|
|
|
|
|
|
|
|
|
||||||
Target Award |
|
|
|
|
|
|
|
|
|
|
|
|
|
|
|
|
|
|
||||||
Outstanding Award |
|
|
|
|
|
|
|
|
|
|
|
|
|
|
|
|
|
|
||||||
Shares Issued in 2024 |
|
|
|
|
N/A |
|
|
N/A |
|
|
N/A |
|
|
N/A |
|
|
N/A |
|
||||||
Shares Issued in 2023 |
|
N/A |
|
|
|
|
|
N/A |
|
|
N/A |
|
|
N/A |
|
|
N/A |
|
||||||
Payout Achieved Over Performance |
|
|
|
|
|
|
|
|
|
|
|
|
|
N/A |
|
|
N/A |
|
||||||
We recognize and adjust compensation expense based on the likelihood of the performance criteria specified in the award being achieved. The compensation expense is recognized over the performance and holding periods and is recorded in selling and administrative expenses. We recognized total compensation expense of $
Savings Related Share Option Scheme
(4) Acquisitions and Dispositions
Acquisitions
From time to time, we acquire and invest in companies throughout the world, including franchises. The total cash consideration paid for acquisitions, net of cash acquired, for the years ended December 31, 2024, 2023, and 2022 was $
As of December 31, 2024, goodwill and other intangible assets resulting from the 2024 acquisitions were $
67
Part II |
Dispositions
Occasionally, we dispose of parts of our operations based on risk considerations and to optimize our global strategic and geographic footprint as well as improve our overall efficiency. On October 15, 2024, we disposed of our Austria business in our Southern Europe segment for cash proceeds of $
On November 1, 2024, we disposed of our South Korea business in our APME segment for cash proceeds of $
On September 29, 2023, we disposed of our Philippines business in our APME segment for total consideration of $
On January 17, 2022, we disposed of our Russia business in our Northern Europe segment for cash proceeds of $
(5) Income Taxes
The provision for income taxes was as follows:
Year Ended December 31 |
|
2024 |
|
|
2023 |
|
|
2022 |
|
|||
|
|
|
|
|
|
|
|
|
|
|||
Current |
|
|
|
|
|
|
|
|
|
|||
United States |
|
|
|
|
|
|
|
|
|
|||
Federal |
|
$ |
|
|
$ |
( |
) |
|
$ |
|
||
State |
|
|
|
|
|
|
|
|
|
|||
Non-United States |
|
|
|
|
|
|
|
|
|
|||
Total current |
|
|
|
|
|
|
|
|
|
|||
Deferred |
|
|
|
|
|
|
|
|
|
|||
United States |
|
|
|
|
|
|
|
|
|
|||
Federal |
|
|
( |
) |
|
|
( |
) |
|
|
|
|
State |
|
|
|
|
|
( |
) |
|
|
|
||
Non-United States |
|
|
( |
) |
|
|
( |
) |
|
|
( |
) |
Total deferred |
|
|
( |
) |
|
|
( |
) |
|
|
|
|
Total provision |
|
$ |
|
|
$ |
|
|
$ |
|
|||
68
Part II |
A tax reconciliation between taxes computed at the United States federal statutory rate of
Year Ended December 31 |
|
2024 |
|
|
2023 |
|
|
2022 |
|
|||
|
|
|
|
|
|
|
|
|
|
|||
Income tax based on statutory rate |
|
$ |
|
|
$ |
|
|
$ |
|
|||
Increase (decrease) resulting from: |
|
|
|
|
|
|
|
|
|
|||
Non-United States tax rate difference: |
|
|
|
|
|
|
|
|
|
|||
French business tax(a) |
|
|
|
|
|
|
|
|
|
|||
Other(b) |
|
|
|
|
|
|
|
|
|
|||
Repatriation of non-United States earnings |
|
|
( |
) |
|
|
|
|
|
|
||
State income taxes, net of federal benefit |
|
|
|
|
|
|
|
|
|
|||
Change in valuation allowance(c) |
|
|
|
|
|
|
|
|
|
|||
Work Opportunity Tax Credit(d) |
|
|
( |
) |
|
|
( |
) |
|
|
( |
) |
Foreign-Derived Intangible Income deduction |
|
|
( |
) |
|
|
( |
) |
|
|
( |
) |
Goodwill impairment(e) |
|
|
|
|
|
|
|
|
|
|||
Change in unrecognized tax benefits(f) |
|
|
( |
) |
|
|
( |
) |
|
|
|
|
Other, net |
|
|
|
|
|
|
|
|
|
|||
Tax provision |
|
$ |
|
|
$ |
|
|
$ |
|
|||
Deferred income taxes are recorded based on temporary differences at the tax rate expected to be in effect when the temporary differences reverse.
December 31 |
|
2024 |
|
|
2023 |
|
||
|
|
|
|
|
|
|
||
Future Income Tax Benefits (Expense) |
|
|
|
|
|
|
||
Accrued payroll taxes and insurance |
|
$ |
|
|
$ |
|
||
Employee compensation payable |
|
|
|
|
|
|
||
Pension and postretirement benefits |
|
|
|
|
|
|
||
Intangible assets |
|
|
( |
) |
|
|
( |
) |
Repatriation of non-United States earnings |
|
|
( |
) |
|
|
( |
) |
Loans denominated in foreign currencies |
|
|
( |
) |
|
|
|
|
Operating lease ROU assets |
|
|
( |
) |
|
|
( |
) |
Operating lease liabilities |
|
|
|
|
|
|
||
Tax credit and other carryforwards |
|
|
|
|
|
|
||
Tax loss carryforwards |
|
|
|
|
|
|
||
Other |
|
|
|
|
|
|
||
Valuation allowance |
|
|
( |
) |
|
|
( |
) |
Total future tax benefits |
|
$ |
|
|
$ |
|
||
Deferred tax asset |
|
$ |
|
|
$ |
|
||
Deferred tax liability |
|
|
( |
) |
|
|
( |
) |
Total future tax benefits |
|
$ |
|
|
$ |
|
||
69
Part II |
For 2024, the Other category was updated to remove tax credit, capital loss, and other carryforwards. The capital loss carryforwards of $
Pre-tax earnings of non-United States operations were $
We had United States federal and non-United States net operating loss carryforwards and United States state net operating loss carryforwards totaling $
|
|
United States |
|
|
United States |
|
||
|
|
|
|
|
|
|
||
2024 |
|
|
|
|
|
|
||
2025 |
|
|
|
|
|
|
||
2026 |
|
|
|
|
|
|
||
2027 |
|
|
|
|
|
|
||
2028 |
|
|
|
|
||||
Thereafter |
|
|
|
|
|
|
||
No expirations |
|
|
|
|
|
|
||
Total net operating loss carryforwards |
|
$ |
|
|
$ |
|
||
We have recorded a deferred tax asset of $
We had gross unrecognized tax benefits related to various tax jurisdictions, including interest and penalties, of $
We recognize accrued interest and penalties related to unrecognized tax benefits in income tax expense. We accrued net interest and penalties of $
70
Part II |
The following table summarizes the activity related to our unrecognized tax benefits during 2024, 2023, and 2022:
|
|
2024 |
|
|
2023 |
|
|
2022 |
|
|||
|
|
|
|
|
|
|
|
|
|
|||
Gross unrecognized tax benefits, beginning of year |
|
$ |
|
|
$ |
|
|
$ |
|
|||
Increases in prior year tax positions |
|
|
|
|
|
|
|
|
|
|||
Decreases in prior year tax positions |
|
|
( |
) |
|
|
( |
) |
|
|
( |
) |
Increases for current year tax positions |
|
|
|
|
|
|
|
|
|
|||
Expiration of statute of limitations and audit settlements |
|
|
( |
) |
|
|
( |
) |
|
|
( |
) |
Gross unrecognized tax benefits, end of year |
|
$ |
|
|
$ |
|
|
$ |
|
|||
Potential interest and penalties |
|
|
|
|
|
|
|
|
|
|||
Balance, end of year |
|
$ |
|
|
$ |
|
|
$ |
|
|||
We conduct business globally in various countries and territories. We are routinely audited by the tax authorities of the various tax jurisdictions in which we operate. Generally, the tax years that could be subject to examination are
(6) Net Earnings Per Share
The calculation of net earnings per share - basic and net earnings per share - diluted were as follows:
Year Ended December 31 |
|
2024 |
|
|
2023 |
|
|
2022 |
|
|||
|
|
|
|
|
|
|
|
|
|
|||
Net earnings available to common shareholders: |
|
$ |
|
|
$ |
|
|
$ |
|
|||
Weighted-average common shares outstanding (in millions): |
|
|
|
|
|
|
|
|
|
|||
Weighted-average common shares outstanding – basic |
|
|
|
|
|
|
|
|
|
|||
Effect of other share-based awards |
|
|
|
|
|
|
|
|
|
|||
Weighted-average common shares outstanding – diluted |
|
|
|
|
|
|
|
|
|
|||
Net earnings per share – basic |
|
$ |
|
|
$ |
|
|
$ |
|
|||
Net earnings per share – diluted |
|
$ |
|
|
$ |
|
|
$ |
|
|||
There were
71
Part II |
(7) Goodwill
Changes in the carrying value of goodwill by reportable segment and Corporate were as follows:
|
|
Americas(a) |
|
|
Southern |
|
|
Northern |
|
|
APME |
|
|
Corporate(c) |
|
|
Total |
|
||||||
|
|
|
|
|
|
|
|
|
|
|
|
|
|
|
|
|
|
|
||||||
Balance, January 1, 2023(d) |
|
$ |
|
|
$ |
|
|
$ |
|
|
$ |
|
|
$ |
|
|
$ |
|
||||||
Impairment Charge(e) |
|
|
|
|
|
|
|
|
( |
) |
|
|
|
|
|
|
|
|
( |
) |
||||
Currency impact |
|
|
|
|
|
|
|
|
|
|
|
( |
) |
|
|
|
|
|
|
|||||
Balance, December 31, 2023(d) |
|
|
|
|
|
|
|
|
|
|
|
|
|
|
|
|
|
|
||||||
Acquisitions |
|
|
|
|
|
|
|
|
|
|
|
|
|
|
|
|
|
|
||||||
Currency impact |
|
|
( |
) |
|
|
( |
) |
|
|
( |
) |
|
|
( |
) |
|
|
( |
) |
|
|
( |
) |
Balance, December 31, 2024(d) |
|
$ |
|
|
$ |
|
|
$ |
|
|
$ |
|
|
$ |
|
|
$ |
|
||||||
(8) Debt
Information concerning short-term borrowings is as follows:
December 31 |
|
2024 |
|
|
2023 |
|
||
|
|
|
|
|
|
|
||
Short-term borrowings |
|
$ |
|
|
$ |
|
||
Weighted-average interest rates |
|
|
% |
|
|
% |
||
We maintain separate bank credit lines with financial institutions to meet working capital needs of our subsidiary operations. As of December 31, 2024, such uncommitted credit lines totaled $
A summary of long-term debt is as follows:
December 31 |
|
2024 |
|
|
2023 |
|
||
|
|
|
|
|
|
|
||
Euro-denominated notes: |
|
|
|
|
|
|
||
€ |
|
$ |
|
|
$ |
|
||
€ |
|
|
|
|
|
|
||
Other |
|
|
|
|
|
|
||
|
|
|
|
|
|
|
||
Less current maturities |
|
|
|
|
|
|
||
Long-term debt |
|
$ |
|
|
$ |
|
||
72
Part II |
Euro Notes
On June 30, 2022, we offered and sold €
On June 22, 2018, we offered and sold €
Both the €
Revolving Credit Agreement
On May 27, 2022, we entered into a new Credit Agreement (the “Credit Agreement”) with a syndicate of commercial banks with a termination date of
Under the Credit Agreement, a credit ratings-based pricing grid determines the facility fee and the credit spread that we add to the applicable interbank borrowing rate on all borrowings. At our current credit rating, the annual facility fee is
Debt Maturities
The maturities of long-term debt payable within each of the four years subsequent to December 31, 2025 are as follows: 2026 - $
73
Part II |
(9) Retirement and Deferred Compensation Plans
For all of our United States defined benefit and retiree health care plans, we adopted the Society of Actuaries’ Pri-2012 Mortality Table with MP-2021 Mortality Improvement Scale in determining the plans’ benefit obligations as of December 31, 2024.
Defined Benefit Pension Plans
We sponsor qualified and nonqualified pension plans covering permanent employees in several countries. In our Switzerland pension plan, we recognized a partial settlement as a result of local regulations and turnover common to our industry and reclassified pension losses of $
|
|
United States Plans |
|
|
Non-United States Plans |
|
||||||||||
|
|
|
|
|
|
|
|
|
|
|
|
|
||||
|
|
|
|
|
|
|
|
|
|
|
|
|
||||
Year Ended December 31 |
|
2024 |
|
|
2023 |
|
|
2024 |
|
|
2023 |
|
||||
|
|
|
|
|
|
|
|
|
|
|
|
|
||||
Change in Benefit Obligation |
|
|
|
|
|
|
|
|
|
|
|
|
||||
Benefit obligation, beginning of year |
|
$ |
|
|
$ |
|
|
$ |
|
|
$ |
|
||||
Service cost |
|
|
|
|
|
|
|
|
|
|
|
|
||||
Interest cost |
|
|
|
|
|
|
|
|
|
|
|
|
||||
Curtailments |
|
|
|
|
|
|
|
|
( |
) |
|
|
|
|||
Settlements |
|
|
|
|
|
|
|
|
( |
) |
|
|
( |
) |
||
Transfers |
|
|
|
|
|
|
|
|
|
|
|
|
||||
Actuarial (gain) loss |
|
|
|
|
|
( |
) |
|
|
( |
) |
|
|
|
||
Plan participant contributions |
|
|
|
|
|
|
|
|
|
|
|
|
||||
Benefits paid |
|
|
( |
) |
|
|
( |
) |
|
|
( |
) |
|
|
( |
) |
Currency exchange rate changes |
|
|
|
|
|
|
|
|
( |
) |
|
|
|
|||
Benefit obligation, end of year |
|
$ |
|
|
$ |
|
|
$ |
|
|
$ |
|
||||
|
|
United States Plans |
|
|
Non-United States Plans |
|
||||||||||
|
|
|
|
|
|
|
|
|
|
|
|
|
||||
|
|
|
|
|
|
|
|
|
|
|
|
|
||||
Year Ended December 31 |
|
2024 |
|
|
2023 |
|
|
2024 |
|
|
2023 |
|
||||
|
|
|
|
|
|
|
|
|
|
|
|
|
||||
Change in Plan Assets |
|
|
|
|
|
|
|
|
|
|
|
|
||||
Fair value of plan assets, beginning of year |
|
$ |
|
|
$ |
|
|
$ |
|
|
$ |
|
||||
Actual return on plan assets |
|
|
|
|
|
|
|
|
|
|
|
|
||||
Settlements |
|
|
|
|
|
|
|
|
( |
) |
|
|
( |
) |
||
Transfers |
|
|
|
|
|
|
|
|
|
|
|
|
||||
Plan participant contributions |
|
|
|
|
|
|
|
|
|
|
|
|
||||
Company contributions |
|
|
|
|
|
|
|
|
|
|
|
|
||||
Benefits paid |
|
|
( |
) |
|
|
( |
) |
|
|
( |
) |
|
|
( |
) |
Currency exchange rate changes |
|
|
|
|
|
|
|
|
( |
) |
|
|
|
|||
Fair value of plan assets, end of year |
|
$ |
|
|
$ |
|
|
$ |
|
|
$ |
|
||||
Funded Status at End of Year |
|
|
|
|
|
|
|
|
|
|
|
|
||||
Funded status, end of year |
|
$ |
( |
) |
|
$ |
( |
) |
|
$ |
( |
) |
|
$ |
( |
) |
Amounts Recognized |
|
|
|
|
|
|
|
|
|
|
|
|
||||
Noncurrent assets |
|
$ |
|
|
$ |
|
|
$ |
|
|
$ |
|
||||
Current liabilities |
|
|
( |
) |
|
|
( |
) |
|
|
( |
) |
|
|
( |
) |
Noncurrent liabilities |
|
|
( |
) |
|
|
( |
) |
|
|
( |
) |
|
|
( |
) |
Net amount recognized |
|
$ |
( |
) |
|
$ |
( |
) |
|
$ |
( |
) |
|
$ |
( |
) |
74
Part II |
The curtailments in 2024 primarily resulted from the wind down of Proservia Germany. For both 2024 and 2023, the settlements and transfers mostly represent transfers in and out of temporary associates within our Switzerland plan. The actuarial gain and loss are mainly related to changes in discount rates.
One of our plans is located in the United Kingdom. In July 2024, the United Kingdom Court of Appeal upheld a ruling in the Virgin Media vs NTL Pension Trustee case, a decision that we were not a party to or involved in, that certain historical amendments for contracted-out defined benefit schemes were invalid if they were not accompanied by the correct actuarial confirmation. Since there remain significant areas of uncertainty, we were not yet able to determine the impact of the ruling, if any, on our pension plan obligations as of December 31, 2024.
Amounts recognized in accumulated other comprehensive loss, net of tax, consisted of:
|
|
United States Plans |
|
|
Non-United States Plans |
|
||||||||||
|
|
|
|
|
|
|
|
|
|
|
|
|
||||
|
|
|
|
|
|
|
|
|
|
|
|
|
||||
Year Ended December 31 |
|
2024 |
|
|
2023 |
|
|
2024 |
|
|
2023 |
|
||||
|
|
|
|
|
|
|
|
|
|
|
|
|
||||
Net loss |
|
$ |
|
|
$ |
|
|
$ |
|
|
$ |
|
||||
Prior service cost |
|
|
|
|
|
|
|
|
|
|
|
|
||||
Total |
|
$ |
|
|
$ |
|
|
$ |
|
|
$ |
|
||||
The accumulated benefit obligation (ABO) for all qualified defined benefit pension plans was $
December 31 |
|
2024 |
|
|
2023 |
|
||
|
|
|
|
|
|
|
||
Accumulated benefit obligation |
|
$ |
|
|
$ |
|
||
Plan assets |
|
|
|
|
|
|
||
The projected benefit obligation (PBO) for all qualified defined benefit pension plans was $
December 31 |
|
2024 |
|
|
2023 |
|
||
|
|
|
|
|
|
|
||
Projected benefit obligation |
|
$ |
|
|
$ |
|
||
Plan assets |
|
|
|
|
|
|
||
75
Part II |
By their nature, some of our plans do not have plan assets. The accumulated benefit obligation for these plans was $
The components of the net periodic benefit cost and other amounts recognized in other comprehensive income/loss for all plans were as follows:
Year Ended December 31 |
|
2024 |
|
|
2023 |
|
|
2022 |
|
|||
|
|
|
|
|
|
|
|
|
|
|||
Net Periodic Benefit Cost |
|
|
|
|
|
|
|
|
|
|||
Service cost |
|
$ |
|
|
$ |
|
|
$ |
|
|||
Interest cost |
|
|
|
|
|
|
|
|
|
|||
Expected return on assets |
|
|
( |
) |
|
|
( |
) |
|
|
( |
) |
Settlements |
|
|
|
|
|
|
|
|
|
|||
Net (gain) loss |
|
|
( |
) |
|
|
( |
) |
|
|
|
|
Prior service cost |
|
|
|
|
|
|
|
|
|
|||
Net periodic benefit cost |
|
|
|
|
|
|
|
|
|
|||
Other Changes in Plan Assets and Benefit Obligation Recognized |
|
|
|
|
|
|
|
|
|
|||
Net (gain) loss |
|
|
( |
) |
|
|
|
|
|
( |
) |
|
Prior service credit |
|
|
|
|
|
( |
) |
|
|
( |
) |
|
Amortization of net loss |
|
|
( |
) |
|
|
( |
) |
|
|
( |
) |
Amortization of prior service cost |
|
|
( |
) |
|
|
( |
) |
|
|
( |
) |
Total recognized in other comprehensive income/loss |
|
|
( |
) |
|
|
|
|
|
( |
) |
|
Total recognized in net periodic benefit cost and other comprehensive |
|
$ |
( |
) |
|
$ |
|
|
$ |
( |
) |
|
The estimated net loss and prior service cost for the defined benefit pension plans that will be amortized from accumulated other comprehensive income/loss into net periodic benefit cost during 2025 are $
T
|
|
United States Plans |
|
|
Non-United States Plans |
|
||||||||||
|
|
|
|
|
|
|
|
|
|
|
|
|
||||
|
|
|
|
|
|
|
|
|
|
|
|
|
||||
Year Ended December 31 |
|
2024 |
|
|
2023 |
|
|
2024 |
|
|
2023 |
|
||||
|
|
|
|
|
|
|
|
|
|
|
|
|
||||
Discount rate |
|
|
% |
|
|
% |
|
|
% |
|
|
% |
||||
Rate of compensation increase |
|
|
% |
|
|
% |
|
|
% |
|
|
% |
||||
The weighted-average assumptions used in the measurement of the net periodic benefit cost were as follows:
|
|
United States Plans |
|
|
Non-United States Plans |
|
||||||||||||||||||
|
|
|
|
|
|
|
|
|
|
|
|
|
|
|
|
|
|
|
||||||
|
|
|
|
|
|
|
|
|
|
|
|
|
|
|
|
|
|
|
||||||
Year Ended December 31 |
|
2024 |
|
|
2023 |
|
|
2022 |
|
|
2024 |
|
|
2023 |
|
|
2022 |
|
||||||
|
|
|
|
|
|
|
|
|
|
|
|
|
|
|
|
|
|
|
||||||
Discount rate |
|
|
% |
|
|
% |
|
|
% |
|
|
% |
|
|
% |
|
|
% |
||||||
Expected long-term return on plan assets |
|
N/A |
|
|
N/A |
|
|
N/A |
|
|
|
% |
|
|
% |
|
|
% |
||||||
Rate of compensation increase |
|
|
% |
|
|
% |
|
|
% |
|
|
% |
|
|
% |
|
|
% |
||||||
Interest crediting rates for cash balance plans |
|
N/A |
|
|
N/A |
|
|
N/A |
|
|
|
% |
|
|
% |
|
|
% |
||||||
We determine our assumption for the discount rate based on an index of high-quality corporate bond yields and matched-funding yield curve analysis as of the end of each fiscal year.
Our overall expected long-term rate of return used in the measurement of the 2024 net periodic benefit cost on non-United States plans varied by country and ranged from
Projected salary levels utilized in the determination of the projected benefit obligation for the pension plans are based upon historical experience and the future expectations for each respective country.
76
Part II |
Our plans’ investment policies are to optimize the long-term return on plan assets at an acceptable level of risk and to maintain careful control of the risk level within each asset class. Our long-term objective is to minimize plan expenses and contributions by outperforming plan liabilities. We have historically used a balanced portfolio strategy based primarily on a target allocation of equity securities and fixed-income instruments, which vary by location. These target allocations, which are similar to the 2024 allocations, are determined based on the favorable risk tolerance characteristics of the plan and, at times, may be adjusted within a specified range to advance our overall objective.
The fair values of our Level 1 and Level 2 pension plan assets are primarily determined by using market quotes and other relevant information that is generated by market transactions involving identical or comparable assets. Insurance contracts and annuity contracts are measured at the present value of expected future benefit payments primarily using associated interest curves. Hedge funds consist of a number of diversified funds including those investing in international securities, equity and private partnership interests valued using market available data and various models and assumptions.
The fair value of our pension plan assets by asset category was as follows:
|
|
Fair Value Measurements Using |
|
|||||||||||||
|
|
|
|
|
|
|
|
|
|
|
|
|
||||
|
|
|
|
|
|
|
|
|
|
|
|
|
||||
|
|
December 31, 2024 |
|
|
Quoted Prices |
|
|
Significant |
|
|
Significant |
|
||||
|
|
|
|
|
|
|
|
|
|
|
|
|
||||
Asset Category |
|
|
|
|
|
|
|
|
|
|
|
|
||||
Cash and cash equivalents |
|
$ |
|
|
$ |
|
|
$ |
|
|
$ |
|
||||
Equity securities: |
|
|
|
|
|
|
|
|
|
|
|
|
||||
Mutual funds |
|
|
|
|
|
|
|
|
|
|
|
|
||||
Common stock |
|
|
|
|
|
|
|
|
|
|
|
|
||||
Fixed income instruments: |
|
|
|
|
|
|
|
|
|
|
|
|
||||
Fixed income funds |
|
|
|
|
|
|
|
|
|
|
|
|
||||
Annuity contract |
|
|
|
|
|
|
|
|
|
|
|
|
||||
Guaranteed insurance contracts |
|
|
|
|
|
|
|
|
|
|
|
|
||||
Other types of investments: |
|
|
|
|
|
|
|
|
|
|
|
|
||||
Real estate funds |
|
|
|
|
|
|
|
|
|
|
|
|
||||
Insurance contracts |
|
|
|
|
|
|
|
|
|
|
|
|
||||
Hedge funds |
|
|
|
|
|
|
|
|
|
|
|
|
||||
Other |
|
|
|
|
|
|
|
|
|
|
|
|
||||
|
|
$ |
|
|
$ |
|
|
$ |
|
|
$ |
|
||||
|
|
Fair Value Measurements Using |
|
|||||||||||||
|
|
|
|
|
|
|
|
|
|
|
|
|
||||
|
|
|
|
|
|
|
|
|
|
|
|
|
||||
|
|
December 31, 2023 |
|
|
Quoted Prices |
|
|
Significant |
|
|
Significant |
|
||||
|
|
|
|
|
|
|
|
|
|
|
|
|
||||
Asset Category |
|
|
|
|
|
|
|
|
|
|
|
|
||||
Cash and cash equivalents |
|
$ |
|
|
$ |
|
|
$ |
|
|
$ |
|
||||
Equity securities: |
|
|
|
|
|
|
|
|
|
|
|
|
||||
Mutual funds |
|
|
|
|
|
|
|
|
|
|
|
|
||||
Common stock |
|
|
|
|
|
|
|
|
|
|
|
|
||||
Fixed income instruments: |
|
|
|
|
|
|
|
|
|
|
|
|
||||
Fixed income funds |
|
|
|
|
|
|
|
|
|
|
|
|
||||
Annuity contract |
|
|
|
|
|
|
|
|
|
|
|
|
||||
Guaranteed insurance contracts |
|
|
|
|
|
|
|
|
|
|
|
|
||||
Other types of investments: |
|
|
|
|
|
|
|
|
|
|
|
|
||||
Real estate funds |
|
|
|
|
|
|
|
|
|
|
|
|
||||
Insurance contracts |
|
|
|
|
|
|
|
|
|
|
|
|
||||
Hedge funds |
|
|
|
|
|
|
|
|
|
|
|
|
||||
Other |
|
|
|
|
|
|
|
|
|
|
|
|
||||
|
|
$ |
|
|
$ |
|
|
$ |
|
|
$ |
|
||||
The following table summarizes the changes in fair value of the pension assets that are measured using Level 3 inputs. We determined that transfers between fair-value-measurement levels occurred on the date of the event that caused the transfer.
77
Part II |
Year Ended December 31 |
|
2024 |
|
|
2023 |
|
||
|
|
|
|
|
|
|
||
Balance, beginning of year |
|
$ |
|
|
$ |
|
||
Actual return on plan assets |
|
|
|
|
|
|
||
Purchases, sales and settlements, net |
|
|
|
|
|
( |
) |
|
Currency exchange rate changes |
|
|
( |
) |
|
|
|
|
Balance, end of year |
|
$ |
|
|
$ |
|
||
Retiree Health Care Plan
We provide medical and dental benefits to certain eligible retired employees in the United States. Due to the nature of the plan, there are no plan assets.
Year Ended December 31 |
|
2024 |
|
|
2023 |
|
||
|
|
|
|
|
|
|
||
Change in Benefit Obligation |
|
|
|
|
|
|
||
Benefit obligation, beginning of year |
|
$ |
|
|
$ |
|
||
Interest cost |
|
|
|
|
|
|
||
Actuarial gain |
|
|
( |
) |
|
|
( |
) |
Benefits paid |
|
|
( |
) |
|
|
( |
) |
Benefit obligation, end of year |
|
$ |
|
|
$ |
|
||
Funded Status at End of Year |
|
|
|
|
|
|
||
Funded status, end of year |
|
$ |
( |
) |
|
$ |
( |
) |
Amounts Recognized |
|
|
|
|
|
|
||
Current liabilities |
|
$ |
( |
) |
|
$ |
( |
) |
Noncurrent liabilities |
|
|
( |
) |
|
|
( |
) |
Net amount recognized |
|
$ |
( |
) |
|
$ |
( |
) |
The amount recognized in accumulated other comprehensive loss, net of tax, consists of a net gain of $
The discount rate used in the measurement of the benefit obligation was
The components of net periodic benefit cost and other amounts recognized in other comprehensive income/loss for this plan were as follows:
Year Ended December 31 |
|
2024 |
|
|
2023 |
|
|
2022 |
|
|||
|
|
|
|
|
|
|
|
|
|
|||
Net Periodic Benefit Credit |
|
|
|
|
|
|
|
|
|
|||
Interest cost |
|
$ |
|
|
$ |
|
|
$ |
|
|||
Net loss |
|
|
|
|
|
|
|
|
|
|||
Prior service credit |
|
|
( |
) |
|
|
( |
) |
|
|
( |
) |
Net periodic benefit credit |
|
$ |
( |
) |
|
$ |
( |
) |
|
$ |
( |
) |
Other Changes in Plan Assets and Benefit Obligations Recognized |
|
|
|
|
|
|
|
|
|
|||
Net gain |
|
$ |
( |
) |
|
$ |
( |
) |
|
$ |
( |
) |
Amortization of net loss |
|
|
|
|
|
|
|
|
( |
) |
||
Amortization of prior service credit |
|
|
|
|
|
|
|
|
|
|||
Total recognized in other comprehensive income/loss |
|
|
( |
) |
|
|
( |
) |
|
|
( |
) |
Total recognized in net periodic benefit cost and other comprehensive |
|
$ |
( |
) |
|
$ |
( |
) |
|
$ |
( |
) |
The estimated prior service credit for the retiree health care plan that will be amortized from accumulated other comprehensive income/loss into net periodic benefit cost during 2025 is $
The health care cost trend rate is assumed to be
78
Part II |
Future Contributions and Payments
During 2025, we plan to contribute approximately $
Year |
|
Pension Plans |
|
|
Retiree Health |
|
||
|
|
|
|
|
|
|
||
2025 |
|
$ |
|
|
$ |
|
||
2026 |
|
|
|
|
|
|
||
2027 |
|
|
|
|
|
|
||
2028 |
|
|
|
|
|
|
||
2029 |
|
|
|
|
|
|
||
2030–2034 |
|
|
|
|
|
|
||
Total projected benefit payments |
|
$ |
|
|
$ |
|
||
Defined Contribution Plans and Deferred Compensation Plans
We have defined contribution plans covering substantially all permanent United States employees and various other employees throughout the world. With our company-sponsored plans, employees may elect to contribute a portion of their salary to the plans and we match a portion of their contributions up to a maximum percentage of the employee’s salary. In addition, profit sharing contributions are made if a targeted earnings level is reached at management’s discretion. The total expense for our match and any profit sharing contributions was $
We also have deferred compensation plans in the United States. These plans had an asset and liability of $
(10) Accumulated Other Comprehensive Loss
The components of accumulated other comprehensive loss, net of tax, were as follows:
December 31 |
|
2024 |
|
|
2023 |
|
||
|
|
|
|
|
|
|
||
Foreign currency translation |
|
$ |
( |
) |
|
$ |
( |
) |
Translation loss on long-term intercompany loans, net of income taxes of $ |
|
|
( |
) |
|
|
( |
) |
Gain (loss) on derivative instruments, net of income tax benefit of $( |
|
|
|
|
|
( |
) |
|
Gain on interest rate swap, net of income taxes of $ |
|
|
|
|
|
|
||
Defined benefit pension plans, net of income tax benefit of $( |
|
|
( |
) |
|
|
( |
) |
Retiree health care plan, net of income taxes of $ |
|
|
|
|
|
|
||
Accumulated other comprehensive loss |
|
$ |
( |
) |
|
$ |
( |
) |
(11) Interest and Other Expenses, Net
Interest and other expenses, net consisted of the following:
Year Ended December 31 |
|
2024 |
|
|
2023 |
|
|
2022 |
|
|||
|
|
|
|
|
|
|
|
|
|
|||
Interest expense |
|
$ |
|
|
$ |
|
|
$ |
|
|||
Interest income |
|
|
( |
) |
|
|
( |
) |
|
|
( |
) |
Foreign exchange loss |
|
|
|
|
|
|
|
|
|
|||
Miscellaneous income, net |
|
|
( |
) |
|
|
( |
) |
|
|
( |
) |
Interest and other expenses, net |
|
$ |
|
|
$ |
|
|
$ |
|
|||
79
Part II |
(12) Derivative Financial Instruments
We are exposed to various market risks relating to our ongoing business operations. The primary market risks, which are managed using derivative instruments, are foreign currency exchange rate risk and interest rate risk. In certain circumstances, we enter into cross-currency swaps and foreign currency forward exchange contracts (“forward contracts”) to reduce the effects of fluctuating foreign currency exchange rates on our cash flows denominated in foreign currencies. Our exposure to market risk for changes in interest rates relates primarily to our long-term debt obligations. We have historically managed interest rate risk through the use of a combination of fixed and variable rate borrowings.
Net Investment Hedges
We use cross-currency swaps, forward contracts and a portion of our foreign currency denominated debt, a non-derivative financial instrument, to protect the value of our net investments in certain of our foreign subsidiaries. For derivative instruments that are designated and qualify as hedges of our net investments in foreign operations, the changes in fair values of the derivative instruments are recognized in foreign currency translation adjustments, a component of accumulated other comprehensive loss (“AOCL”), to offset the changes in the values of the net investments being hedged. For non-derivative financial instruments that are designated and qualify as hedges of net investments in foreign operations, the change in the carrying value of the designated portion of the non-derivative financial instrument due to changes in foreign currency exchange rates is recorded in foreign currency translation adjustments.
The €
In September 2022, we entered into a new cross-currency swap agreement that converts fixed-rate Swiss franc ("CHF") payments to fixed-rate United States dollar payments. This swap was designated as a net investment hedge of our foreign subsidiaries with CHF functional currency.
The effect of our net investment hedges on AOCL for the year ended December 31, 2024, and 2023 was as follows:
|
|
Gain (Loss) Recognized in Other Comprehensive Income |
|||||||
|
|
Year Ended December 31, |
|
|
|||||
|
|
|
|
|
|
|
|
||
|
|
|
|
|
|
|
|
||
Instrument |
|
2024 |
|
|
2023 |
|
|
||
|
|
|
|
|
|
|
|
||
|
|
|
|
|
|
|
|
||
Euro Notes |
|
$ |
|
|
$ |
( |
) |
|
|
|
|
|
|
|
|
|
|
||
Cross-currency swaps |
|
|
|
|
|
( |
) |
|
|
Cash Flow Hedges
We use forward currency exchange contracts to hedge the changes in cash flows of certain operational expenses denominated in foreign currency due to changes in foreign currency exchange rates. The changes in fair value of the forward currency exchange contracts derivatives are recorded in AOCL and reclassified into earnings when the underlying operating expense is recognized in earnings.
On June 9, 2022, we entered into a forward starting interest rate swap agreement with a notional amount of €
The following table presents the impact that changes in the fair values of derivatives designated as cash flow hedges had on OCI, AOCL and earnings for the year ended December 31, 2024, and 2023:
|
|
|
|
|
|
|
Gain (Loss) Reclassified |
|
||||||||||
|
|
Gain (Loss) Recognized in OCI |
|
|
|
|
from AOCL into Income |
|
||||||||||
|
|
|
|
|
|
|
|
|
|
|
|
|
|
|
||||
|
|
|
|
|
|
|
|
|
|
|
|
|
|
|
||||
|
|
Year Ended December 31, |
|
|
Location of Gain Reclassified |
|
Year Ended December 31, |
|
||||||||||
|
|
|
|
|
|
|
|
|
|
|
|
|
|
|
||||
|
|
|
|
|
|
|
|
|
|
|
|
|
|
|
||||
Instrument |
|
2024 |
|
|
2023 |
|
|
from AOCL into Income |
|
2024 |
|
|
2023 |
|
||||
|
|
|
|
|
|
|
|
|
|
|
|
|
|
|
||||
Forward starting interest swap |
|
|
|
|
|
|
|
Interest and other expenses, net |
|
|
|
|
|
|
||||
80
Part II |
We expect the net amount of pre-tax derivative gains and losses included in AOCL on December 31, 2024 to be reclassified into earnings over the next 12 months will not be significant. The actual amount that will be reclassified to earnings will vary due to future currency exchange rates.
Fair Value Hedges
We account for derivatives as fair value hedges when the hedged item is a recognized asset, liability, or firm commitment. We use cross currency swaps to hedge the changes in cash flows of certain of our foreign currency denominated intercompany notes due to changes in foreign currency exchange rates. We record the change in carrying value of the foreign currency denominated notes due to changes in exchange rates into earnings each period. The changes in fair value of the cross-currency swap derivatives are recorded in other comprehensive income (“OCI”) with an immediate reclassification into earnings for the change in fair value attributable to fluctuations in foreign currency exchange rates.
In March 2022, we entered into a cross currency swap agreement to hedge an intercompany fixed-rate CHF denominated note, including the annual interest payment, to a fixed-rate Euro denominated note. In April 2024, we settled the swaps at maturity for a net cash inflow of $
In September 2022, we entered into a cross currency swap agreement to hedge an intercompany fixed-rate CHF denominated note, including the annual interest payment, to a fixed-rate Euro denominated note. On September 26, 2024, we settled the swaps at maturity for a net cash inflow of $
The following tables present the impact that the fair value hedges had on our Consolidated Statement of Operations for the year ended December 31, 2024 and 2023:
|
|
Gain (Loss) Recognized in OCI |
|
|
|
|
Gain (Loss) Recognized in Income |
|
||||||||||
|
|
Year Ended December 31, |
|
|
Location of Gain (Loss) |
|
Year Ended December 31, |
|
||||||||||
Instrument |
|
2024 |
|
|
2023 |
|
|
Recognized in Income |
|
2024 |
|
|
2023 |
|
||||
Intercompany CHF notes |
|
$ |
|
|
$ |
|
|
Interest and other expenses, net |
|
$ |
|
|
$ |
( |
) |
|||
Cross-currency swaps |
|
|
|
|
|
( |
) |
|
Interest and other expenses, net |
|
|
( |
) |
|
|
|
||
Non-Designated Instruments
We also use certain derivatives, which are not designated as hedging instruments, as economic hedges of foreign currency and interest rate exposure. For our forward contracts that are not designated as hedges, any gain or loss resulting from the change in fair value is recognized in current period earnings. These gains or losses are offset by the exposure related to receivables and payables with our foreign subsidiaries and to interest due on our Euro-denominated notes, which is paid annually in June.
|
|
Location of Gain |
|
Gain (Loss) Recognized in Income |
|
|||||
Instrument |
|
Recognized in Income |
|
Year Ended December 31, |
|
|||||
|
|
|
|
2024 |
|
|
2023 |
|
||
Foreign currency forward contracts |
|
Interest and other expenses, net |
|
$ |
( |
) |
|
$ |
|
|
81
Part II |
Derivative and Non-Derivative Assets and Liabilities
The following tables present the fair value of derivative and non-derivative assets and liabilities on the Consolidated Balance Sheets as of December 31, 2024, and 2023:
|
|
Assets |
|
|||||||
|
|
|
|
December 31, |
|
|
December 31, |
|
||
|
|
Balance Sheet Location |
|
2024 |
|
|
2023 |
|
||
|
|
|
|
|
|
|
|
|
||
Instruments designated as fair value hedges: |
|
|
|
|
|
|
|
|
||
Cross-currency swaps |
|
Accounts Receivable, net |
|
|
|
|
|
|
||
Instruments designated as net investment hedges: |
|
|
|
|
|
|
|
|
||
Cross-currency swaps |
|
Accounts Receivable, net |
|
|
|
|
|
|
||
Instruments not designated as hedges: |
|
|
|
|
|
|
|
|
||
Foreign currency forward contracts |
|
Accounts Receivable, net |
|
|
|
|
|
|
||
Total instruments |
|
|
|
$ |
|
|
$ |
|
||
|
|
Liabilities |
|
|||||||
|
|
|
|
December 31, |
|
|
December 31, |
|
||
|
|
Balance Sheet Location |
|
2024 |
|
|
2023 |
|
||
|
|
|
|
|
|
|
|
|
||
Instruments designated as net investment hedges: |
|
|
|
|
|
|
|
|
||
Euro Notes due in 2026 |
|
Long-term debt |
|
|
|
|
|
|
||
Euro Notes due in 2027 |
|
Long-term debt |
|
|
|
|
|
|
||
Cross-currency swaps |
|
Accrued liabilities |
|
|
|
|
|
|
||
Instruments not designated as hedges: |
|
|
|
|
|
|
|
|
||
Foreign currency forward contracts |
|
Accrued liabilities |
|
|
|
|
|
|
||
Total instruments |
|
|
|
$ |
|
|
$ |
|
||
The fair value measurements of these items recorded in our Consolidated Balance Sheets for the years ended December 31, 2024 and 2023 are disclosed in Note 1 to the Consolidated Financial Statements.
(13) Leases
The components of lease expense were as follows:
Year Ended December 31 |
|
2024 |
|
|
2023 |
|
|
2022 |
|
|||
|
|
|
|
|
|
|
|
|
|
|||
Operating lease expense |
|
$ |
|
|
$ |
|
|
$ |
|
|||
Short-term lease expense |
|
|
|
|
|
|
|
|
|
|||
Other lease expense(a) |
|
|
|
|
|
|
|
|
|
|||
Total lease expense |
|
$ |
|
|
$ |
|
|
$ |
|
|||
Other information related to leases was as follows:
Year Ended December 31 |
|
2024 |
|
|
2023 |
|
|
2022 |
|
|||
Cash paid for amounts included in the measurement of operating lease liabilities |
|
$ |
|
|
$ |
|
|
$ |
|
|||
Right-of-use assets obtained in exchange for new operating lease liabilities |
|
|
|
|
|
|
|
|
|
|||
Weighted-average remaining lease term – operating leases |
|
|
|
|
|
|
||||||
Weighted-average discount rate – operating leases |
|
|
% |
|
|
% |
|
|
% |
|||
82
Part II |
|
|
December 31, |
|
|
December 31, |
|
||
Supplemental Balance Sheet Information |
|
2024 |
|
|
2023 |
|
||
Operating lease right-of-use assets |
|
$ |
|
|
$ |
|
||
|
|
|
|
|
|
|
||
) |
|
$ |
|
|
$ |
|
||
Long-term operating lease liability |
|
|
|
|
|
|
||
Total operating lease liabilities |
|
$ |
|
|
$ |
|
||
Maturities of operating lease liabilities as of December 31, 2024 were as follows:
Period Ending December 31, 2024 |
|
Operating Leases |
|
|
2025 |
|
$ |
|
|
2026 |
|
|
|
|
2027 |
|
|
|
|
2028 |
|
|
|
|
2029 |
|
|
|
|
Thereafter |
|
|
|
|
Total future undiscounted lease payments |
|
|
|
|
Less imputed interest |
|
|
( |
) |
Total operating lease liabilities |
|
$ |
|
|
(14) Segment Data
Effective January 1, 2024, our segment reporting was realigned to include our Puerto Rico business within Other Americas. Accordingly, United States is now adjusted to exclude Puerto Rico. All previously reported results have been restated to conform to the current year presentation.
Our chief operating decision maker ("CODM") is our Chief Executive Officer, who evaluates the performance of our operating segments using operating unit profit ("OUP"). OUP serves as the measure of profitability for monitoring actual results against budgeted expectations as well as investment and resource allocation among our segments. In addition, the CODM utilizes OUP in conducting competitive analysis, benchmarking our performance against that of our competitors and determining compensation.
We are organized and managed primarily on a geographic basis. Each country and business unit generally has its own distinct operations and management team, providing services under our global brands and maintains its own financial reports. Each operation reports directly or indirectly through a regional manager to a member of executive management. Given this reporting structure, we operate using the following reporting segments: Americas, which includes United States and Other Americas; Southern Europe, which includes France, Italy and Other Southern Europe; Northern Europe; and APME.
The segments derive a majority of their revenues from our staffing and interim services. The remaining revenues within these segments are derived from our outcome-based solutions and consulting services, permanent recruitment services, outplacement services, talent management services and other services. Segment revenues represent sales to external clients. We provide services to a wide variety of clients, none of which individually comprise a significant portion of revenues for us as a whole. Due to the nature of our business, we generally do not have export sales.
83
Part II |
T
Year Ended December 31, 2024 |
|
Revenue |
|
|
Cost of Services |
|
|
Selling and |
|
|
OUP |
|
||||
Americas: |
|
|
|
|
|
|
|
|
|
|
|
|
||||
United States(a) |
|
$ |
|
|
$ |
|
|
$ |
|
|
$ |
|
||||
Other Americas |
|
|
|
|
|
|
|
|
|
|
|
|
||||
|
|
|
|
|
|
|
|
|
|
|
|
|
||||
Southern Europe: |
|
|
|
|
|
|
|
|
|
|
|
|
||||
France |
|
|
|
|
|
|
|
|
|
|
|
|
||||
Italy |
|
|
|
|
|
|
|
|
|
|
|
|
||||
Other Southern Europe |
|
|
|
|
|
|
|
|
|
|
|
|
||||
|
|
|
|
|
|
|
|
|
|
|
|
|
||||
Northern Europe |
|
|
|
|
|
|
|
|
|
|
|
( |
) |
|||
APME |
|
|
|
|
|
|
|
|
|
|
|
|
||||
Total Segments |
|
|
|
|
|
|
|
|
|
|
|
|
||||
Intercompany Eliminations |
|
|
( |
) |
|
|
( |
) |
|
|
( |
) |
|
|
|
|
|
|
$ |
|
|
$ |
|
|
$ |
|
|
$ |
|
||||
Reconciliation of operating unit profit (segment OUP) |
|
|
|
|
|
|
|
|
|
|
|
|
||||
Corporate expenses |
|
|
|
|
|
|
|
|
|
|
$ |
( |
) |
|||
Goodwill impairment charges |
|
|
|
|
|
|
|
|
|
|
|
|
||||
Intangible asset amortization expense(b) |
|
|
|
|
|
|
|
|
|
|
|
( |
) |
|||
Operating profit |
|
|
|
|
|
|
|
|
|
|
|
|
||||
Interest and other expenses, net |
|
|
|
|
|
|
|
|
|
|
|
( |
) |
|||
Earnings before income taxes |
|
|
|
|
|
|
|
|
|
|
$ |
|
||||
Year Ended December 31, 2024 |
|
Total Assets |
|
|
Long-lived Assets(a) |
|
|
Depreciation and |
|
|||
|
|
|
|
|
|
|
|
|
|
|||
Americas: |
|
|
|
|
|
|
|
|
|
|||
United States |
|
$ |
|
|
$ |
|
|
$ |
|
|||
Other Americas |
|
|
|
|
|
|
|
|
|
|||
|
|
|
|
|
|
|
|
|
|
|||
Southern Europe: |
|
|
|
|
|
|
|
|
|
|||
France |
|
|
|
|
|
|
|
|
|
|||
Italy |
|
|
|
|
|
|
|
|
|
|||
Other Southern Europe |
|
|
|
|
|
|
|
|
|
|||
|
|
|
|
|
|
|
|
|
|
|||
Northern Europe |
|
|
|
|
|
|
|
|
|
|||
APME |
|
|
|
|
|
|
|
|
|
|||
Corporate(b) |
|
|
|
|
|
|
|
|
|
|||
Intangible asset amortization expense(c) |
|
|
|
|
|
|
|
|
|
|||
|
|
$ |
|
|
$ |
|
|
$ |
|
|||
84
Part II |
Year Ended December 31, 2023 |
|
Revenue |
|
|
Cost of Services |
|
|
Selling and |
|
|
OUP |
|
||||
|
|
|
|
|
|
|
|
|
|
|
|
|
||||
Americas:(a) |
|
|
|
|
|
|
|
|
|
|
|
|
||||
United States(b) |
|
$ |
|
|
$ |
|
|
$ |
|
|
$ |
|
||||
Other Americas |
|
|
|
|
|
|
|
|
|
|
|
|
||||
|
|
|
|
|
|
|
|
|
|
|
|
|
||||
Southern Europe: |
|
|
|
|
|
|
|
|
|
|
|
|
||||
France |
|
|
|
|
|
|
|
|
|
|
|
|
||||
Italy |
|
|
|
|
|
|
|
|
|
|
|
|
||||
Other Southern Europe |
|
|
|
|
|
|
|
|
|
|
|
|
||||
|
|
|
|
|
|
|
|
|
|
|
|
|
||||
Northern Europe |
|
|
|
|
|
|
|
|
|
|
|
( |
) |
|||
APME |
|
|
|
|
|
|
|
|
|
|
|
|
||||
Total Segments |
|
|
|
|
|
|
|
|
|
|
|
|
||||
Intercompany Eliminations |
|
|
( |
) |
|
|
( |
) |
|
|
|
|
|
|
||
|
|
$ |
|
|
$ |
|
|
$ |
|
|
$ |
|
||||
Reconciliation of operating unit profit (segment OUP) |
|
|
|
|
|
|
|
|
|
|
|
|
||||
Corporate expenses |
|
|
|
|
|
|
|
|
|
|
$ |
( |
) |
|||
Goodwill impairment charges |
|
|
|
|
|
|
|
|
|
|
|
( |
) |
|||
Intangible asset amortization expense(c) |
|
|
|
|
|
|
|
|
|
|
|
( |
) |
|||
Operating profit |
|
|
|
|
|
|
|
|
|
|
|
|
||||
Interest and other expenses, net |
|
|
|
|
|
|
|
|
|
|
|
( |
) |
|||
Earnings before income taxes |
|
|
|
|
|
|
|
|
|
|
$ |
|
||||
Year Ended December 31, 2023 |
|
Total Assets |
|
|
Long-lived Assets(a) |
|
|
Depreciation and |
|
|||
|
|
|
|
|
|
|
|
|
|
|||
Americas:(b) |
|
|
|
|
|
|
|
|
|
|||
United States |
|
$ |
|
|
$ |
|
|
$ |
|
|||
Other Americas |
|
|
|
|
|
|
|
|
|
|||
|
|
|
|
|
|
|
|
|
|
|||
Southern Europe: |
|
|
|
|
|
|
|
|
|
|||
France |
|
|
|
|
|
|
|
|
|
|||
Italy |
|
|
|
|
|
|
|
|
|
|||
Other Southern Europe |
|
|
|
|
|
|
|
|
|
|||
|
|
|
|
|
|
|
|
|
|
|||
Northern Europe |
|
|
|
|
|
|
|
|
|
|||
APME |
|
|
|
|
|
|
|
|
|
|||
Corporate(c) |
|
|
|
|
|
|
|
|
|
|||
Intangible asset amortization expense(d) |
|
|
|
|
|
|
|
|
|
|||
|
|
$ |
|
|
$ |
|
|
$ |
|
|||
85
Part II |
Year Ended December 31, 2022 |
|
Revenue |
|
|
Cost of Services |
|
|
Selling and |
|
|
OUP |
|
||||
|
|
|
|
|
|
|
|
|
|
|
|
|
||||
Americas:(a) |
|
|
|
|
|
|
|
|
|
|
|
|
||||
United States(b) |
|
$ |
|
|
$ |
|
|
$ |
|
|
$ |
|
||||
Other Americas |
|
|
|
|
|
|
|
|
|
|
|
|
||||
|
|
|
|
|
|
|
|
|
|
|
|
|
||||
Southern Europe: |
|
|
|
|
|
|
|
|
|
|
|
|
||||
France |
|
|
|
|
|
|
|
|
|
|
|
|
||||
Italy |
|
|
|
|
|
|
|
|
|
|
|
|
||||
Other Southern Europe |
|
|
|
|
|
|
|
|
|
|
|
|
||||
|
|
|
|
|
|
|
|
|
|
|
|
|
||||
Northern Europe |
|
|
|
|
|
|
|
|
|
|
|
|
||||
APME |
|
|
|
|
|
|
|
|
|
|
|
|
||||
Total Segments |
|
|
|
|
|
|
|
|
|
|
|
|
||||
Intercompany Eliminations |
|
|
( |
) |
|
|
( |
) |
|
|
|
|
|
|
||
|
|
$ |
|
|
$ |
|
|
$ |
|
|
$ |
|
||||
Reconciliation of operating unit profit (segment OUP) |
|
|
|
|
|
|
|
|
|
|
|
|
||||
Corporate expenses |
|
|
|
|
|
|
|
|
|
|
$ |
( |
) |
|||
Goodwill impairment charges |
|
|
|
|
|
|
|
|
|
|
|
( |
) |
|||
Intangible asset amortization expense(c) |
|
|
|
|
|
|
|
|
|
|
|
( |
) |
|||
Operating profit |
|
|
|
|
|
|
|
|
|
|
|
|
||||
Interest and other expenses, net |
|
|
|
|
|
|
|
|
|
|
|
( |
) |
|||
Earnings before income taxes |
|
|
|
|
|
|
|
|
|
|
$ |
|
||||
Year Ended December 31, 2022 |
|
Total |
|
|
Long-lived Assets(a) |
|
|
Depreciation and |
|
|||
|
|
|
|
|
|
|
|
|
|
|||
Americas:(b) |
|
|
|
|
|
|
|
|
|
|||
United States |
|
$ |
|
|
$ |
|
|
$ |
|
|||
Other Americas |
|
|
|
|
|
|
|
|
|
|||
|
|
|
|
|
|
|
|
|
|
|||
Southern Europe: |
|
|
|
|
|
|
|
|
|
|||
France |
|
|
|
|
|
|
|
|
|
|||
Italy |
|
|
|
|
|
|
|
|
|
|||
Other Southern Europe |
|
|
|
|
|
|
|
|
|
|||
|
|
|
|
|
|
|
|
|
|
|||
Northern Europe |
|
|
|
|
|
|
|
|
|
|||
APME |
|
|
|
|
|
|
|
|
|
|||
Corporate(c) |
|
|
|
|
|
|
|
|
|
|||
Intangible asset amortization expense(d) |
|
|
|
|
|
|
|
|
|
|||
|
|
$ |
|
|
$ |
|
|
$ |
|
|||
86
Part II |
(15) Commitments and Contingencies
Guarantees
We have entered into certain guarantee contracts and stand-by letters of credit that total $
Litigation
In the normal course of business, the Company is named as a defendant in various legal proceedings in which claims are asserted against the Company. We record accruals for loss contingencies based on the circumstances of each claim, when it is probable that a loss has been incurred as of the balance sheet date and can be reasonably estimated. Although the outcome of litigation cannot be predicted with certainty, we believe the ultimate resolution of these legal proceedings will not have a material effect on our business or financial condition.
87
Part II |
Item 9. Changes in and Disagreements with Accountants on Accounting and Financial Disclosure
Not applicable.
Item 9A. Controls and Procedures
Disclosure Controls and Procedures
We maintain a set of disclosure controls and procedures that are designed to ensure that information required to be disclosed by us in the reports that we file or submit under the Securities Exchange Act of 1934, as amended (the "Exchange Act") is recorded, processed, summarized and reported, within the time periods specified in the SEC’s rules and forms. Disclosure controls and procedures include, without limitation, controls and procedures designed to ensure that information required to be disclosed by us in the reports we file under the Exchange Act is accumulated and communicated to our management, including our principal executive and principal financial officers, or persons performing similar functions, as appropriate to allow timely decisions regarding required disclosure. We carried out an evaluation, under the supervision and with the participation of our management, including our Chief Executive Officer and our Executive Vice President and Chief Financial Officer, of the effectiveness of the design and operation of our disclosure controls and procedures at a reasonable assurance level pursuant to Rule 13a-15 of the Exchange Act. Based on that evaluation, our Chief Executive Officer and our Executive Vice President and Chief Financial Officer concluded that, as of the end of the period covered by this report, our disclosure controls and procedures were effective at the reasonable assurance level.
Management Report on Internal Control over Financial Reporting
We are responsible for establishing and maintaining effective internal control over financial reporting as defined in Rule 13a-15(f) under the Exchange Act. Our internal control over financial reporting is a process designed to provide reasonable assurance to management and the Board of Directors regarding the reliability of financial reporting and the preparation of financial statements for external purposes in accordance with generally accepted accounting principles.
Because of its inherent limitations, internal control over financial reporting may not prevent or detect misstatements. Also, projections of any evaluation of effectiveness to future periods are subject to the risk that controls may become inadequate because of changes in conditions, or that the degree of compliance with the policies or procedures may deteriorate.
Under the supervision and with the participation of management, including our Chief Executive Officer and our Executive Vice President and Chief Financial Officer, we conducted an evaluation of the effectiveness of our internal control over financial reporting based on the framework in Internal Control — Integrated Framework (2013) issued by the Committee of Sponsoring Organizations of the Treadway Commission. This evaluation included review of the documentation of controls, evaluation of the design effectiveness of controls, testing of the operating effectiveness of controls and a conclusion on this evaluation. Based on our evaluation we have concluded that our internal control over financial reporting was effective as of December 31, 2024.
The effectiveness of our internal control over financial reporting as of December 31, 2024 has been audited by Deloitte & Touche LLP, an independent registered public accounting firm, as stated in their report which appears herein.
Internal Control over Financial Reporting
There have been no changes in our internal control over financial reporting that occurred during our last fiscal quarter that have materially affected, or are reasonably likely to materially affect, our internal control over financial reporting.
[Item 9B. Other Information]
Trading Plans
During the quarter ended December 31, 2024, no director or Section 16 officer
Item 9C. Disclosure Regarding Foreign Jurisdictions that Prevent Inspections
Not applicable.
88
Part III |
PART III
Item 10. Directors, Executive Officers and Corporate Governance
Item 11. Executive Compensation
The information required by this Item is set forth in our Proxy Statement for the Annual Meeting of Shareholders to be held on May 2, 2025, under the captions "Compensation Discussion and Analysis," "Compensation Tables," "Compensation Policies and Practices as they Relate to Risk Management," "CEO Pay Ratio," “People, Culture and Compensation Committee Interlocks and Insider Participation;” and “Report of the People, Culture and Compensation Committee of the Board of Directors,” and "Equity Grant and Approval Timing Practices", which information is hereby incorporated herein by reference.
89
Part III |
Item 12. Security Ownership of Certain Beneficial Owners and Management and Related Shareholder Matters
The information required by this Item is set forth in our Proxy Statement for the Annual Meeting of Shareholders to be held on May 2, 2025, under the caption “Security Ownership of Certain Beneficial Owners,” and under the caption “Beneficial Ownership of Directors and Executive Officers,” which information is hereby incorporated herein by reference.
The following table sets forth information as of December 31, 2024 about our shares of common stock outstanding and available for issuance under our existing equity compensation plans.
Plan category |
|
Number of |
|
|
Weighted-average |
|
|
Weighted-average |
|
|
Number of securities |
|
||||
Equity compensation plans approved |
|
|
2,478,867 |
|
|
$ |
77.38 |
|
|
|
2.1 |
|
|
|
3,259,215 |
|
Equity compensation plans not approved |
|
|
— |
|
|
|
— |
|
|
|
— |
|
|
|
— |
|
Total |
|
|
2,478,867 |
|
|
$ |
77.38 |
|
|
|
2.1 |
|
|
|
3,259,215 |
|
The information required by this Item is set forth in our Proxy Statement for the Annual Meeting of Shareholders to be held on May 2, 2025, under the caption “Board Independence and Related Party Transactions” and “Meetings and Committees of the Board,” which information is hereby incorporated herein by reference.
Item 14. Principal Accounting Fees and Services
The information required by this Item is set forth in our Proxy Statement for the Annual Meeting of Shareholders to be held on May 2, 2025, under the captions “Fees Billed by Deloitte” and “Independent Auditor Services Policy” in the Audit Committee Report, which information is hereby incorporated herein by reference.
90
Part IV |
PART IV
Item 15. Exhibits and Financial Statement Schedules.
(a)(1) Financial Statements.
(a)(2) Financial Statement Schedule.
SCHEDULE II—Valuation and Qualifying Accounts
For the years ended December 31, 2024, 2023 and 2022, in millions:
Allowance for Expected Credit Losses:
|
|
Balance at |
|
Bad Debt Expense |
|
Write-Offs |
|
Translation |
|
Reclassifications |
|
Balance |
||||||||||||||||||
2024 |
|
$ |
|
|
|
$ |
|
|
|
$ |
( |
) |
|
|
$ |
( |
) |
|
|
$ |
|
|
|
$ |
|
|
||||
2023 |
|
|
|
|
|
|
|
|
|
|
( |
) |
|
|
|
|
|
|
|
|
|
|
|
|
|
|||||
2022 |
|
|
|
|
|
|
|
|
|
|
( |
) |
|
|
|
( |
) |
|
|
|
( |
) |
|
|
|
|
|
|||
Valuation Allowance for Deferred Tax Assets:
|
|
Balance at |
|
Charged to Income Tax Expense (Benefit) |
|
Charged to Other Accounts (a) |
|
Balance |
||||||||||||
2024 |
|
$ |
|
|
|
$ |
|
|
|
$ |
( |
) |
|
|
$ |
|
|
|||
2023 |
|
|
|
|
|
|
|
|
|
|
|
|
|
|
|
|
||||
2022 |
|
|
|
|
|
|
|
|
|
|
( |
) |
|
|
|
|
|
|||
(a)(3) Exhibits.
See (c) below.
Pursuant to Regulation S-K, Item 601(b)(4)(iii), ManpowerGroup Inc. hereby agrees to furnish to the Commission, upon request, a copy of each instrument and agreement with respect to long-term debt of ManpowerGroup Inc. and its consolidated subsidiaries which does not exceed 10 percent of the total assets of ManpowerGroup Inc. and its subsidiaries on a consolidated basis.
91
Part IV |
(c) Exhibits.
3.1 |
|
|
|
3.2 |
|
|
|
4.1 |
|
|
|
4.2 |
|
|
|
4.3 |
|
|
|
10.1 |
|
|
|
10.2 |
|
|
|
10.3 |
|
|
|
10.6(a) |
|
|
|
10.6(b) |
|
|
|
10.6(c) |
|
|
|
10.6(d) |
Transition Agreement between Richard Buchband and the Company as of December 17, 2024. ** |
|
|
10.6(e) |
|
|
|
10.6(f) |
10.7(a) |
|
|
|
92
Part IV |
10.7(b) |
|
|
|
10.7(c) |
|
|
|
10.7(d) |
|
|
|
10.7(e) |
|
|
|
10.7(f) |
|
|
|
10.8(a) |
|
|
|
10.8(b) |
|
|
|
10.9 |
|
|
|
19.1 |
|
|
|
21 |
|
|
|
23.1 |
|
|
|
24 |
|
|
|
31.1 |
|
|
|
31.2 |
|
|
|
32.1 |
Statement of Jonas Prising, Chief Executive Officer, pursuant to 18 U.S.C. ss. 1350. |
|
|
32.2 |
|
|
|
97 |
|
|
|
101.INS |
Inline XBRL Instance Document - the instance document does not appear in the Interactive Data File because its XBRL tags are embedded within the Inline XBRL document. |
|
|
101.SCH |
Inline XBRL Taxonomy Extension Schema With Embedded Linkbase Documents |
|
|
104 |
The cover page from the Company’s Annual Report on Form 10-K for the fiscal year ended December 31, 2024 has been formatted in Inline XBRL (Inline Extensible Business Reporting Language). |
|
|
** Management contract or compensatory plan or arrangement.
93
Part IV |
Item 16. Form 10-K summary
Not applicable.
94
Part IV |
SIGNATURES
Pursuant to the requirements of Section 13 or 15(d) of the Securities Exchange Act of 1934, the Registrant has duly caused this report to be signed on its behalf by the undersigned, thereunto duly authorized.
|
|
MANPOWERGROUP INC. |
|
|
|
|
|
|
|
By: |
/s/ Jonas Prising |
|
|
|
Jonas Prising Chairman and Chief Executive Officer |
|
|
|
|
|
|
Date: |
February 19, 2025 |
Pursuant to the requirements of the Securities Exchange Act of 1934, this report has been signed below by the following persons on behalf of the registrant and in the capacities and on the dates indicated.
Name |
|
Title |
|
Date |
|
|
|
|
|
/s/ Jonas Prising |
|
Chairman, Chief Executive Officer and a Director |
|
February 19, 2025 |
Jonas Prising |
|
(Principal Executive Officer) |
|
|
|
|
|
|
|
/s/ John T. McGinnis |
|
Executive Vice President and Chief Financial Officer |
|
February 19, 2025 |
John T. McGinnis |
|
(Principal Financial Officer) |
|
|
|
|
|
|
|
/s/ Eric Rozek |
|
Vice President and Global Controller |
|
February 19, 2025 |
Eric Rozek |
|
(Principal Accounting Officer) |
|
|
Directors: Jean-Philippe Courtois, John F. Ferraro, William P. Gipson, Patricia A. Hemingway Hall, Julie M. Howard, Muriel Pénicaud, Ulice Payne, Jr., Paul Read, Elizabeth P. Sartain, and Michael J. Van Handel
By: |
|
/s/ John T. McGinnis |
|
|
John McGinnis Attorney-In-Fact* |
|
|
|
Date: |
|
February 19, 2025 |
* Pursuant to authority granted by powers of attorney, copies of which are filed herewith.
95
EXHIBIT 10.6(d)
TRANSITION AND RETIREMENT AGREEMENT
This Transition and Retirement Agreement (this “Agreement”) is entered into by and among ManpowerGroup Inc. (the “Company”) and Richard Buchband (“Executive”) (Executive and the Company are collectively referred to herein as the “Parties”).
WHEREAS, Executive has been employed by the Company as its Senior Vice President, General Counsel and Secretary; and
WHEREAS, the Parties have agreed to a transition in connection with Executive’s retirement and the Company’s reallocation of certain duties and responsibilities among its key executives; and
WHEREAS, the Parties desire to set forth the terms and conditions of this transition, Executive’s retirement, Executive’s continued involvement with the Company during a transition period, all as set forth in this Agreement;
NOW, THEREFORE, in consideration of the promises and mutual covenants set forth herein, the Parties agree effective as of December 17, 2024 (the “Effective Date”), as follows:
Because Executive is employed on an “at will” basis, either the Company or Executive may terminate Executive’s employment with the Company at any time and for any or no reason. Notwithstanding the foregoing, however, if the Company terminates Executive’s employment with the Company other than for Cause (as defined in the letter agreement between the Company and Executive dated February 17, 2023), the Company will provide the compensation and benefits described in Section 2, above, and will also provide the Retirement Vesting (as defined below); provided, however, that the Company shall only provide the compensation described in this Section 3 if Executive executes a Final Release (as defined below) during the time period permitted under the terms of the Final Release, and the Final Release becomes irrevocable under its terms.
In the event Executive’s employment or service with the Company terminates due to Executive’s death or disability (as defined in the letter agreement between the Company and Executive dated February 17, 2023), the provisions of Section 3 will also apply and will also be subject to a requirement that a Final Release be executed; provided, however, that in the event of Executive’s death, the Final Release must be executed by a party authorized to act on behalf of Executive’s estate.
2
3
IN WITNESS WHEREOF, the Parties have executed this Agreement as of the Effective Date.
RICHARD BUCHBAND |
MANPOWERGROUP INC.
|
/s/ Richard Buchband___________________ |
By: _/s/ Jonas Prising____________ Title: Chief Executive Officer______ |
|
|
4

Insider Trading Policy Exhibit 19.1


| Purpose | Scope III. | Prohibited Activities | Non-Public Information | Material Information | Pre-Clearance Of All Trades By Directors, Executive Officers And Certain Other Employees; Trading Window | Post-Employment Transactions | Violations Of Policy | Reporting And Non-Retaliation | Insider Trading Compliance Officer; Certain Certifications TABLE OF CONTENTS Insider Trading Policy

3 Insider Trading Policy 2025 Purpose The federal securities laws prohibit “insider trading.” Insider trading refers generally to buying or selling company securities while in possession of material non-public information of a company and continues to be a major focus of the enforcement program of the U.S. Securities and Exchange Commission (the “SEC”). In order to take an active role in the prevention of insider trading violations under the U.S. federal securities laws, ManpowerGroup Inc. (together with its subsidiaries, the “Company”) has adopted this Insider Trading Policy (this “Policy”). Scope This Policy covers all directors, officers and employees of the Company and their respective household members (collectively referred to as “Covered Persons”). In addition, this Policy applies to all entities (e.g., corporations, partnerships or trusts) that are influenced or controlled by any Covered Person, and transactions by any of these entities should be treated for purposes of this Policy as if they were for the account of a Covered Person. INSIDER TRADING POLICY

4 Insider Training Policy 2025 No Trades While in Possession of Material Non-Public Information. Except as otherwise permitted under this Policy, no Covered Person may buy, sell, transfer or otherwise acquire or dispose of: Any Company securities while in possession of material non-public information about the Company (see sections IV and V for more information); or Any securities of any other company, including Company customers, while in possession of material non-public information relating to that company which was obtained in the course of service to the Company or from any Covered Person. No Derivative Transactions. No Covered Person may engage in transactions in puts, calls or other options or derivative instruments that are based on Company securities. No Hedging. No Covered Person may engage in hedging transactions involving Company securities, including forward sale or purchase contracts, equity swaps or exchange funds. No Trading on Margin or Pledging. No Covered Person may hold Company securities in a margin account or pledge Company securities as collateral for a loan. III. Prohibited Activities No Tipping. No Covered Person may communicate material non-public information about the Company to any other person, including other Covered Persons, except for a valid Company purpose. Sharing material non-public information with another person to enable them to make a profit or avoid a loss through trading is sometimes called “tipping.” Tipping also includes making recommendations, “signaling” or expressing opinions about trading, while aware of material non-public information. This is illegal and may expose both the “tipper” and “tippee” to civil and criminal penalties. No Short Sales. No Covered Person may engage in short sales of Company securities. A short sale is the sale of a security that the seller does not own at the time of the trade.

5 Insider Trading Policy 2025 IV. Non-Public Information For purposes of this Policy, non-public information is defined as information which is not generally available to the investing public. Information will be considered generally available to the investing public two days after full dissemination of the information through a national news service or the filing of a report containing the information with the SEC, whichever occurs first. V. Material Information For purposes of this Policy, material information is defined as any information that would affect a reasonable investor’s decision to buy, hold or sell securities or would affect the price of securities. The following types of information are examples of information that may be considered material for purposes of this Policy: Revenues or earnings, including projections of future earnings or losses; Proposals, plans or agreements, even if preliminary in nature, involving a significant merger or acquisition, tender offer, significant sale of assets or disposition of a significant subsidiary; Major financing transactions; Changes in dividend rates or policies; Sales or purchases by the Company of its own securities; Changes in senior management; Significant write-downs in assets or increases in reserves; Actual, threatened or potential exposure to significant litigation or governmental investigations; Significant cybersecurity incidents; and Changes in debt ratings.

6 Insider Training Policy 2025 VI. Pre-Clearance of All Trades by Directors, Executive Officers and Certain Other Employees; Trading Window All transactions in Company securities by directors, executive officers and other Covered Persons designated by the Compliance Officer (collectively, the “Pre-Clearance List”) must be pre-cleared by the Compliance Officer before the transaction occurs. For Covered Persons on the Pre-Clearance List, transactions will generally be limited to a trading window commencing two days after the public release of quarterly financial information (the “Release”) and ending on the fifth day of the third month of the quarter following the quarter to which such Release relates. This period is generally referred to as the “Trading Window.” If you are on the Pre-Clearance List, you must submit a request in writing to the Compliance Officer requesting approval to trade, and your transaction must be approved and completed during a Trading Window. Under certain circumstances, the Compliance Officer may extend, shorten or suspend the Trading Window and the Covered Persons to whom it applies. Additionally, if the requestor becomes aware of material non-public information before a transaction is executed, the pre-clearance is void and the transaction must not be completed. If a pre-clearance request is denied, then the requestor should refrain from initiating any transaction in Company securities and should not inform any other person of the restriction. Special rules apply to transactions under a written trading plan pursuant to Exchange Act Rule 10b5-1, and any such plan would likewise need approval by the Compliance Officer. Covered Persons who are not on the Pre-Clearance List are encouraged, but not required, to limit their trading activity to the Trading Window. VII. Post-Employment Transactions When a Covered Person’s employment or tenure as a director terminates, the Covered Person will continue to be subject to this Policy until such person is no longer in possession of material non-public information as provided in this Policy. In addition, if the Covered Person’s transactions in Company securities are subject to pre-clearance requirements and the Covered Person’s employment or tenure as a director terminates while the Trading Window is closed, the Covered Person will continue to be subject to such pre-clearance and Trading Window requirements until the Trading Window re-opens.

7 Insider Trading Policy 2025 VIII. Violations of Policy Violations of this Policy may constitute grounds for corrective action, up to, and including, immediate dismissal. Additionally, individuals violating federal insider trading laws may be subject to civil and criminal penalties and may also subject the Company to liability. Exceptions to this Policy for particular transactions, if any, may only be granted by the Compliance Officer in advance of the proposed transaction. IX. Reporting and Non-Retaliation Any Company employee who becomes aware, or suspects, that this Policy may have been violated shall immediately notify management using one of the following channels: Notify the Compliance Officer or the Global Ethics Compliance Officer Use the local ethics helpline number posted at such employee’s facility Use the global ManpowerGroup Business Ethics Hotline, by using one of the following methods: Calling 1-800-210-3458, a toll-free telephone number that is monitored 24 hours per day; or Through the online reporting system at https://manpowergroup.ethicspoint.com. The Company will not tolerate retaliation against anyone who makes a report in good faith, as stated in the ManpowerGroup Anti-Retaliation Policy. X. Insider Trading Compliance Officer; Certain Certifications In order to ensure compliance with this Policy by the Company and all Covered Persons, the Company has designated its Associate General Counsel, Shannon Kobylarczyk, as the Compliance Officer. The Compliance Officer is authorized to: Administer this Policy and monitor and enforce compliance with it; Formulate and implement procedures and educational programs designed to promote the effectiveness of this Policy; Designate Covered Persons whose transactions are subject to pre-clearance and/or limited to the Trading Window; and Respond to questions concerning this Policy and its application to specific transactions. In this regard, Covered Persons may be required to certify that they have read this Policy.

? LAST REVISED: JANUARY 2025 QUESTIONS Any Covered Person who has a question about this Policy, any specific securities transaction or prohibitions on trading while in possession of material non-public information should contact the Compliance Officer. Any such question should be resolved prior to any trade which may potentially be prohibited.
Exhibit 21
SUBSIDIARIES OF MANPOWERGROUP INC.
As of December 31, 2024
Corporation Name |
|
Incorporated in State /Country of |
Benefits S.A. |
|
Argentina |
Cotecsud Compania Technica Sudamericana S.A.S.E. |
|
Argentina |
Experis S.A. |
|
Argentina |
Salespower S.A. |
|
Argentina |
EXPERIS AUSTRALIA PTY LTD |
|
Australia |
Manpower Services (Australia) Pty. Ltd. |
|
Australia |
Manpower Staffing (Australia) Pty Limited |
|
Australia |
Manpower Staffing Holdings (Australia) Pty Limited |
|
Australia |
Right Management Consultants (OC) Pty Ltd. |
|
Australia |
Right Management Consultants Holdings Pty Ltd |
|
Australia |
Right Management Consultants International Pty Ltd |
|
Australia |
Right Management Consultants Pty Ltd |
|
Australia |
INT Technologies, LLC |
|
AZ |
ManpowerGroup Captive Insurance Inc. |
|
AZ |
Experis Belgium SA |
|
Belgium |
Manpower Personal Services NV |
|
Belgium |
ManpowerGroup Solutions Belgium SA |
|
Belgium |
Right Management Belgium NV |
|
Belgium |
S.A. Manpower (Belgium) N.V. |
|
Belgium |
Stegmann Belgium BVBA |
|
Belgium |
Anyhelp Brasil Assessoria E Servicos em Sistemas de Informacao Ltda. |
|
Brazil |
Manpower Brasil Ltda. |
|
Brazil |
Manpower Staffing Ltda. |
|
Brazil |
Right do Brasil Ltda. |
|
Brazil |
Manpower, Inc. / California Peninsula |
|
CA |
Misicom Inc |
|
CA |
Experis Canada Inc. |
|
Canada |
Ibis CA Acquisition, ULC |
|
Canada |
Manpower Services Canada Limited |
|
Canada |
Right Management Canada |
|
Canada |
Experis Servicios Profesionales SpA |
|
Chile |
Manpower Empresa de Servicios Transitorios Ltda |
|
Chile |
Manpower Servicios Especializados Ltda |
|
Chile |
Manpower Servicios Integrales SpA |
|
Chile |
Talent Solutions Capacitacion SpA |
|
Chile |
Aerospace Solutions Engineering, LLC |
|
CO |
Fahrenheit IT, LLC |
|
CO |
Exhibit 21
Global Employment Solutions, LLC |
|
CO |
Information Technology Engineering, LLC |
|
CO |
ITEC II, LLC |
|
CO |
Manpower de Colombia Ltda. |
|
Colombia |
Manpower Professional Ltd. |
|
Colombia |
Tahuma SAS |
|
Colombia |
Manpower Costa Rica, S.A. |
|
Costa Rica |
Manpower Professional Costa Rica, S.A. |
|
Costa Rica |
ManpowerGroup s.r.o. |
|
Czech Republic |
Workforce Solutions s.r.o. |
|
Czech Republic |
Econometrix, LLC |
|
DE |
ettain group Holdings, LLC |
|
DE |
Experis Finance US, LLC |
|
DE |
Experis IT Services US, LLC |
|
DE |
Friendly Advanced Software Technology, LLC |
|
DE |
Leidos Health, LLC |
|
DE |
Manpower Franchises, LLC |
|
DE |
Manpower Holdings, Inc. |
|
DE |
Manpower NZ Holdings LLC |
|
DE |
Manpower US Inc. |
|
DE |
ManpowerGroup Holdings LLC |
|
DE |
ManpowerGroup Talent Solutions, LLC |
|
DE |
ManpowerGroup US Holdings LLC |
|
DE |
TAPFIN LLC |
|
DE |
Experis A/S |
|
Denmark |
Manpower Republica Dominicana, S.A. |
|
Dominican Republic |
Manpower El Salvador, S.A. de C.V. |
|
El Salvador |
Manpower OÜ |
|
Estonia |
Manpower Inclusive Oy |
|
Finland |
ManpowerGroup OY |
|
Finland |
ManpowerGroup Solutions OY |
|
Finland |
Experis France SAS |
|
France |
FuturSkill IT SAS |
|
France |
Manpower France Holding SAS |
|
France |
Manpower France SAS |
|
France |
Manpower Nouvelles Competences SAS |
|
France |
ManpowerGroup France SAS |
|
France |
ManpowerGroup Solutions SAS |
|
France |
Supplay SAS |
|
France |
Tingari SASU |
|
France |
Temporary Placement Service, LLC |
|
GA |
7S Group GmbH |
|
Germany |
Arcqus GmbH |
|
Germany |
Exhibit 21
Arcqus Professionals GmbH |
|
Germany |
Aviation Staff Management GmbH |
|
Germany |
AviationPower GmbH |
|
Germany |
AviationPower Technical Services GmbH |
|
Germany |
Bankpower GmbH Personaldienstleistungen |
|
Germany |
Experis Field Services GmbH |
|
Germany |
Experis GmbH |
|
Germany |
Experis IT Services GmbH & Co. KG |
|
Germany |
Experis Verwaltungs GmbH |
|
Germany |
K&K HR-Services GmbH |
|
Germany |
Manpower Beteiligungsgesellschaft GmbH |
|
Germany |
Manpower Experts GmbH |
|
Germany |
Manpower GmbH & Co. KG |
|
Germany |
Manpower Personaldienstleistung GmbH |
|
Germany |
ManpowerGroup Deutschland GmbH & Co. KG |
|
Germany |
ManpowerGroup Deutschland Verwaltungs GmbH |
|
Germany |
ManpowerGroup Financial Services GmbH |
|
Germany |
ManpowerGroup Solutions GmbH |
|
Germany |
Right Management GmbH |
|
Germany |
Splu Experts GmbH |
|
Germany |
VIS GmbH |
|
Germany |
ManpowerGroup S.A. |
|
Greece |
Project Solutions S.A. |
|
Greece |
Manpower Professional Guatemala S.A. |
|
Guatemala |
Manpower S.A. |
|
Guatemala |
Manpower Honduras, S.A. |
|
Honduras |
Tupromotoria Honduras, S.A. |
|
Honduras |
Jefferson Wells HK Limited |
|
Hong Kong |
ManpowerGroup Solutions Holdings Hong Kong Limited |
|
Hong Kong |
Geneva Technical Services, LLC |
|
IL |
HG Chicago Consulting, LLC |
|
IL |
Experis IT Private Limited |
|
India |
ManpowerGroup Services India Pvt. Ltd. |
|
India |
Right Management India Pvt. Limited |
|
India |
Rotostat Services Private Limited |
|
India |
P.T. Manpower Business Solutions Indonesia |
|
Indonesia |
Manpower Holdings (Ireland) Limited |
|
Ireland |
ManpowerGroup (Ireland) Limited |
|
Ireland |
Right Transition Ltd |
|
Ireland |
Adam Ltd. |
|
Israel |
Adi Ltd. |
|
Israel |
Experis BI Ltd. |
|
Israel |
Experis Cyber Ltd. |
|
Israel |
Exhibit 21
Experis I.T.S. Ltd. |
|
Israel |
Experis Software Ltd. |
|
Israel |
M.F.S. Manpower Facility Services Ltd. |
|
Israel |
M.G.S.M. Advanced Medical Services Ltd |
|
Israel |
Manpower Care Ltd. |
|
Israel |
Manpower Israel Limited |
|
Israel |
ManpowerGroup Israel Holdings Ltd. |
|
Israel |
MNPM Solutions LTD. |
|
Israel |
Nativ 2 Ltd. |
|
Israel |
Talent Solutions Ltd. |
|
Israel |
Telepower Ltd. |
|
Israel |
Experis Srl |
|
Italy |
Manpower Srl |
|
Italy |
Manpower TBO S.r.l. |
|
Italy |
ManpowerGroup Service S.r.l. |
|
Italy |
Talent Solutions s.r.l. |
|
Italy |
Experis Executive Co. Ltd. |
|
Japan |
ManpowerGroup Co. Ltd. |
|
Japan |
ManpowerGroup PLUS Co., Ltd. |
|
Japan |
Pro-Hunt Co., Ltd. |
|
Japan |
Representative Office of UAB "Manpower Lit" in Latvia |
|
Latvia |
Manpower Lit UAB |
|
Lithuania |
Elan IT Resource S.a.r.l. |
|
Luxembourg |
Manpower Business Solutions Luxembourg S.A. |
|
Luxembourg |
Manpower Luxembourg S.A. |
|
Luxembourg |
Centerline Partners LLC |
|
MA |
Agensi Pekerjaan Manpower Recruitment Sdn Bhd |
|
Malaysia |
Experis (M) Sdn Bhd |
|
Malaysia |
Manpower Business Solutions (M) Sdn Bhd |
|
Malaysia |
Manpower Staffing Services (Malaysia) Sdn Bhd |
|
Malaysia |
Pancaran Pertiwi Sdn Bhd |
|
Malaysia |
Agropower, S.A. de C.V. |
|
Mexico |
Business Logistics Managers, S.A. de C.V. |
|
Mexico |
Experis Mexico S.A. de C.V. |
|
Mexico |
Experts Business Transportation, S.A. de C.V. |
|
Mexico |
Factoria Y Manufactura S.A. de C.V. |
|
Mexico |
Innovacion Tecnologia Smart, S.A. de C.V. |
|
Mexico |
Innovation Administrative Process, S.A. de C.V. |
|
Mexico |
Innovative Food Process, S.A. de C.V. |
|
Mexico |
Innovative Industrial Assembly, S.A. de C.V. |
|
Mexico |
Intelecto Tecnologico, S.A. De C.V. |
|
Mexico |
Manpower Corporativo, S.A. de C.V. |
|
Mexico |
Manpower Industrial, S. de R.L. de C.V. |
|
Mexico |
Exhibit 21
Manpower Professional, S.A. de C.V. |
|
Mexico |
Manpower, S.A. de C.V. |
|
Mexico |
Nurse.Co de Mexico, S.A. de C.V. |
|
Mexico |
Payment Services S.A. de C.V. |
|
Mexico |
Right Management Mexico, S.A. de C.V. |
|
Mexico |
Smart Administracion y Soporte, S.A. de C.V. |
|
Mexico |
Tecnologia Y Manufactura, S.A. de C.V. |
|
Mexico |
Tupromotoria, S.A. de C.V. |
|
Mexico |
HG Atlanta Consulting, LLC |
|
MI |
HG Detroit Consulting, LLC |
|
MI |
Bradford & Galt |
|
MO |
Manpower Monaco SAM |
|
Monaco |
Management Business Services Maroc Sarl |
|
Morocco |
MBSM S.A.R.L.A.U. |
|
Morocco |
Societe Marocaine De Travail Temporaire |
|
Morocco |
ettain group, LLC |
|
NC |
Experis Consulting B.V. |
|
Netherlands |
Experis Professionals B.V. |
|
Netherlands |
Experis Services B.V. |
|
Netherlands |
Experis Staff B.V. |
|
Netherlands |
Manpower B.V. |
|
Netherlands |
Manpower Business Professionals B.V. |
|
Netherlands |
Manpower Business Services BV |
|
Netherlands |
Manpower Flexibility BV |
|
Netherlands |
Manpower Flexwork BV |
|
Netherlands |
Manpower Logistics BV |
|
Netherlands |
Manpower Solutions B.V. |
|
Netherlands |
Manpower Talent BV |
|
Netherlands |
Manpower Talentworkers BV |
|
Netherlands |
ManpowerGroup Netherlands B.V. |
|
Netherlands |
ManpowerGroup Solutions B.V. |
|
Netherlands |
ManpowerGroup Staff B.V. |
|
Netherlands |
Right Management Nederland B.V. |
|
Netherlands |
Manpower Nouvelle Caledonie Sarl |
|
New Caledonia |
Manpower Recrutement Sarl |
|
New Caledonia |
Manpower Nicaruagua S.A. |
|
Nicaragua |
Experis AS |
|
Norway |
Experis Services AS |
|
Norway |
Manpower Framnaes Installasjon AS |
|
Norway |
Manpower AS |
|
Norway |
Manpower Staffing Services AS |
|
Norway |
ManpowerGroup AS |
|
Norway |
Talent Solutions AS |
|
Norway |
Exhibit 21
Workshop Bemanning og Kompetanse AS |
|
Norway |
Workshop Holding AS |
|
Norway |
Workshop Solutions AS |
|
Norway |
Right Management LLC |
|
PA |
Manpower Panama S.A. |
|
Panama |
ManpowerGroup Panama Pacifico, S.A. |
|
Panama |
Staffing Services Panama, S.A. |
|
Panama |
Manpower Paraguay S.R.L. |
|
Paraguay |
Manpower Peru S.A. |
|
Peru |
Manpower Professional Services S.A. |
|
Peru |
Right Management Peru S.A.C. |
|
Peru |
HR Hunters Sp. z.o.o. |
|
Poland |
Manpower Transactions Sp. z.o.o. |
|
Poland |
ManpowerGroup Solutions Sp. z.o.o. |
|
Poland |
ManpowerGroup Sp. z.o.o. |
|
Poland |
MP Actions Sp. z.o.o. |
|
Poland |
MP Management Sp. z.o.o. |
|
Poland |
MP Services Sp. z.o.o. |
|
Poland |
Experis Lda. |
|
Portugal |
Manpower Portugal Empresa de Trabalho Temporario S.A. |
|
Portugal |
ManpowerGroup Global Business Service, Unipessoal Lda. |
|
Portugal |
ManpowerGroup Portugal - SGPS, S.A. |
|
Portugal |
ManpowerGroup Talent Based Outsourcing, Unipessoal Lda. |
|
Portugal |
Manpower HR SRL |
|
Romania |
SC Manpower Romania SRL |
|
Romania |
Clarendon Parker Arabia |
|
Saudi Arabia |
Manpower Professional Singapore Pte Ltd |
|
Singapore |
Manpower Staffing Services (Singapore) Pte. Ltd. |
|
Singapore |
ManpowerGroup Singapore Private Limited |
|
Singapore |
Right Management Singapore Pte. Ltd. |
|
Singapore |
ManpowerGroup Slovensko s.r.o. |
|
Slovakia |
ManpowerGroup Solutions s.r.o. |
|
Slovakia |
ManpowerGroup SA (Pty) Ltd. |
|
South Africa |
Experis ManpowerGroup S.L.U. |
|
Spain |
Manpower Team E.T.T., S.A.U. |
|
Spain |
ManpowerGroup Innovative Talent Solutions S.L.U. |
|
Spain |
ManpowerGroup Solutions, S.L.U. |
|
Spain |
Right Management Spain, S.L.U. |
|
Spain |
Elan IT Resource AB |
|
Sweden |
Experis AB |
|
Sweden |
Manpower & Jefferson Wells AB |
|
Sweden |
Manpower AB |
|
Sweden |
Manpower EL & Tele AB |
|
Sweden |
Exhibit 21
Manpower Flexjobb AB |
|
Sweden |
Manpower Matchning AB |
|
Sweden |
ManpowerGroup AB |
|
Sweden |
ManpowerGroup Solutions AB |
|
Sweden |
ManpowerGroup Solutions IT AB |
|
Sweden |
Right Management Sweden AB |
|
Sweden |
Experis AG |
|
Switzerland |
Experis Schweiz AG |
|
Switzerland |
Manpower AG |
|
Switzerland |
ManpowerGroup SA |
|
Switzerland |
Talent Solutions ManpowerGroup AG |
|
Switzerland |
Manpower Services (Taiwan) Co., Ltd. |
|
Taiwan |
Borderless Talent Solutions Recruitment Co., Limited |
|
Thailand |
HR Power Solution Co., Ltd. |
|
Thailand |
Manpower Professional and Executive Recruitment Co., Ltd. |
|
Thailand |
Skillpower Services (Thailand) Co. Ltd. |
|
Thailand |
Manpower Insan Kaynaklari Limited Sirketi |
|
Turkey |
Manpower Secme ve Yerlestirme Hizmetleri Limited Sirketi |
|
Turkey |
Manpower Middle East FZ-LLC |
|
UAE |
Manpower, Middle East Ltd |
|
UAE |
777 Recruitment Limited |
|
United Kingdom |
Bafin Holdings |
|
United Kingdom |
Brook Street (UK) Limited |
|
United Kingdom |
Brook Street Bureau Limited |
|
United Kingdom |
BS Project Services Limited |
|
United Kingdom |
Comsys VMS Limited |
|
United Kingdom |
Experis Finance Limited |
|
United Kingdom |
Experis Group Limited |
|
United Kingdom |
Experis Limited |
|
United Kingdom |
Experis Resource Support Services Limited |
|
United Kingdom |
Jefferson Wells Limited |
|
United Kingdom |
Juice Resource Solutions Limited |
|
United Kingdom |
Manpower Holdings (UK) Limited |
|
United Kingdom |
Manpower IT Services Limited |
|
United Kingdom |
Manpower Nominees Limited |
|
United Kingdom |
Manpower Services Ltd. |
|
United Kingdom |
Manpower UK Limited |
|
United Kingdom |
ManpowerGroup (Scot) LP |
|
United Kingdom |
ManpowerGroup Digital Holdings Ltd. |
|
United Kingdom |
ManpowerGroup Financing UK Ltd. |
|
United Kingdom |
ManpowerGroup Scotland LLP |
|
United Kingdom |
ManpowerGroup UK Limited |
|
United Kingdom |
Nicholas Andrews Limited |
|
United Kingdom |
Exhibit 21
People Source Consulting Limited |
|
United Kingdom |
People Source Limited |
|
United Kingdom |
Right Management Limited |
|
United Kingdom |
RMC EMEA Ltd. |
|
United Kingdom |
SJB Corporate Limited |
|
United Kingdom |
SJB Services UK Limited |
|
United Kingdom |
The Empower Group Ltd. |
|
United Kingdom |
Volaris Exec Recruitment Limited |
|
United Kingdom |
Aris Sociedad Anonima |
|
Uruguay |
ManpowerGroup Public Sector Inc. |
|
VA |
Manpower de Venezuela C.A. |
|
Venezuela |
Manpower Empresa de Trabajo Temporal, C.A. |
|
Venezuela |
Servicios Alleray, C.A. |
|
Venezuela |
Manpower Vietnam Company Ltd. |
|
Vietnam |
Experis US LLC |
|
WI |
Manpower Nominees Inc. |
|
WI |
ManpowerGroup Global Inc. |
|
WI |
ManpowerGroup Mexico Holdings LLC |
|
WI |
ManpowerGroup US Inc. |
|
WI |
Signature Graphics of Milwaukee, LLC |
|
WI |
Exhibit 23.1
CONSENT OF INDEPENDENT REGISTERED PUBLIC ACCOUNTING FIRM
We consent to the incorporation by reference in Registration Statement Nos. 33-40441, 333-1040, 333-105205, 333-126703, 333-135000, 333-161765, 333-174305, 333-195833, and 333-238801 on Form S-8 and Registration Nos. 333-650 and 33-95896 on Form S-4 of our reports dated February 19, 2025, relating to the consolidated financial statements and consolidated financial statement schedule of ManpowerGroup Inc. and subsidiaries (the “Company”), and the effectiveness of the Company’s internal control over financial reporting, appearing in this Annual Report on Form 10-K of ManpowerGroup Inc. for the year ended December 31, 2024.
/s/ Deloitte & Touche LLP
Milwaukee, Wisconsin
February 19, 2025
Exhibit 24
POWER OF ATTORNEY FOR ANNUAL REPORT ON FORM 10-K
Each of the undersigned directors of ManpowerGroup Inc. (the “Company”) hereby constitutes and appoints Jonas Prising, John T. McGinnis and Richard Buchband, and each of them, the undersigned’s true and lawful attorney-in-fact and agent, with full power of substitution and resubstitution, for the undersigned and in the undersigned’s name, place and stead to sign for the undersigned and in the undersigned’s name in the capacity as a director of the Company the Annual Report on Form 10-K for the Company’s fiscal year ended December 31, 2024, and to file the same, with all exhibits thereto, other documents in connection therewith, and any amendments to any of the foregoing, with the Securities and Exchange Commission and any other regulatory authority, granting unto said attorney-in-fact and agent full power and authority to do and perform each and every act and thing requisite and necessary to be done in and about the premises, as fully and to all intents and purposes as the undersigned might or could do in person, hereby ratifying and confirming all that said attorney-in-fact and agent, or the undersigned’s substitute, may lawfully do or cause to be done by virtue hereof.
IN WITNESS WHEREOF, the undersigned have each executed this Power of Attorney for Annual Report on Form 10-K, on one or more counterparts, as of the 24th day of January, 2024.
|
/s/ Jean-Philippe Courtois |
|
/s/ Ulice Payne, Jr. |
|
|
Jean-Philippe Courtois |
|
Ulice Payne, Jr. |
|
|
|
|
|
|
|
|
|
|
|
|
/s/ William Downe |
|
/s/ Muriel Pénicaud |
|
|
William Downe |
|
Muriel Pénicaud |
|
|
|
|
|
|
|
|
|
|
|
|
/s/ John F. Ferraro |
|
/s/ Jonas Prising |
|
|
John F. Ferraro |
|
Jonas Prising |
|
|
|
|
|
|
|
|
|
|
|
|
/s/ William P. Gipson |
|
/s/ Paul Read |
|
|
William P. Gipson |
|
Paul Read |
|
|
|
|
|
|
|
|
|
|
|
|
/s/ Patricia Hemingway Hall |
|
/s/ Elizabeth P. Sartain |
|
|
Patricia Hemingway Hall |
|
Elizabeth P. Sartain |
|
|
|
|
|
|
|
|
|
|
|
|
/s/ Julie M. Howard |
|
/s/ Michael J. Van Handel |
|
|
Julie M. Howard |
|
Michael J. Van Handel |
|
Exhibit 31.1
CERTIFICATION
I, Jonas Prising, Chairman and Chief Executive Officer of ManpowerGroup Inc., certify that:
Dated: February 19, 2025 |
|
|
|
/s/ Jonas Prising |
|
Jonas Prising |
|
Chairman and Chief Executive Officer |
|
Exhibit 31.2
CERTIFICATION
I, John T. McGinnis, Executive Vice President and Chief Financial Officer of ManpowerGroup Inc., certify that:
Dated: February 19, 2025 |
|
|
|
/s/ John T. McGinnis |
|
John T. McGinnis |
|
Executive Vice President and Chief Financial Officer |
|
Exhibit 32.1
STATEMENT
Pursuant to ss. 906 of the Sarbanes-Oxley Act of 2002, 18 U.S.C. ss. 1350, the undersigned officer of ManpowerGroup Inc. (the “Company”), hereby certifies that to his knowledge:
MANPOWERGROUP INC. |
|
Dated: February 19, 2025 |
|
/s/ Jonas Prising |
Jonas Prising |
Chairman and Chief Executive Officer |
This certification accompanies this Annual Report on Form 10-K pursuant to Section 906 of the Sarbanes-Oxley Act of 2002 and shall not be deemed filed by the Company for purposes of the Securities Exchange Act of 1934.
Exhibit 32.2
STATEMENT
Pursuant to ss. 906 of the Sarbanes-Oxley Act of 2002, 18 U.S.C. ss. 1350, the undersigned officer of ManpowerGroup Inc. (the “Company”), hereby certifies that to his knowledge:
MANPOWERGROUP INC. |
|
Dated: February 19, 2025 |
|
/s/ John T. McGinnis |
John T. McGinnis |
Executive Vice President and Chief Financial Officer |
This certification accompanies this Annual Report on Form 10-K pursuant to Section 906 of the Sarbanes-Oxley Act of 2002 and shall not be deemed filed by the Company for purposes of the Securities Exchange Act of 1934.
Exhibit 97
ManpowerGroup Inc.
SENIOR EXECUTIVE COMPENSATION RECOVERY POLICY
Adopted as of August 4, 2023
The purpose of this Policy is to describe the circumstances in which Covered Individuals will be required to repay or return Erroneously Awarded Compensation to members of the Company Group in the event of an Accounting Restatement. This Policy is designed to comply with, and shall be interpreted to be consistent with, Section 10D of the Exchange Act, Rule 10D-1 promulgated under the Exchange Act and Section 303A.14 of the NYSE Listed Company Manual.
This Policy shall be administered by the Committee. Any determinations made by the Committee shall be final and binding on all affected individuals.
For purposes of this Policy, the following capitalized terms shall have the meanings set forth below.
“Accounting Restatement” shall mean an accounting restatement (i) due to the material noncompliance of the Company with any financial reporting requirement under the securities laws, including any required accounting restatement to correct an error in previously issued financial statements that is material to the previously issued financial statements (a “Big R” restatement), or (ii) that corrects an error that is not material to previously issued financial statements, but would result in a material misstatement if the error were corrected in the current period or left uncorrected in the current period (a “little r” restatement).
“Clawback Eligible Incentive Compensation” shall mean, in connection with an Accounting Restatement and with respect to each individual who served as a Covered Individual at any time during the applicable performance period for any Incentive-Based Compensation (whether or not such Covered Individual is serving at the time the Erroneously Awarded Compensation is required to be repaid to the Company Group), all Incentive-Based Compensation Received by such Covered Individual (i) on or after the Effective Date, (ii) after beginning service as a Covered Individual, (iii) while the Company has a class of securities listed on a national securities exchange or a national securities association, and (iv) during the applicable Clawback Period.
“Clawback Period” shall mean, with respect to any Accounting Restatement, the three (3) completed fiscal years of the Company immediately preceding the Restatement Date and any transition period (that results from a change in the Company’s fiscal year) within or immediately
1
Exhibit 97
following those three (3) completed fiscal years. However, a transition period between the last day of the Company’s previous fiscal year end and the first day of its new fiscal year that comprises a period of nine (9) to twelve (12) months shall be deemed a completed fiscal year.
“Committee” shall mean the People, Culture and Compensation Committee of the Board of Directors of the Company.
“Company” shall mean ManpowerGroup Inc., a Wisconsin corporation.
“Company Group” shall mean the Company, together with each of its direct and indirect subsidiaries.
“Covered Individuals” shall mean (i) each Executive Officer and (ii) other senior officers of the Company as may be determined from time to time by the Committee.
“Effective Date” shall mean October 2, 2023.
“Erroneously Awarded Compensation” shall mean, with respect to each Covered Individual in connection with an Accounting Restatement, the amount of Clawback Eligible Incentive Compensation that is Received by such Covered Individual that exceeds the amount of Incentive-Based Compensation that otherwise would have been Received by such Covered Individual had it been determined based on the restated amounts, computed without regard to any taxes paid. With respect to any compensation plans or programs that take into account Incentive-Based Compensation, the amount of Erroneously Awarded Compensation subject to recovery hereunder includes, but is not limited to, the amount contributed to any notional account based on Erroneously Awarded Compensation and any earnings accrued to date on that notional amount.
“Executive Officer” shall mean each individual who is or was designated as an “officer” of the Company in accordance with 17 C.F.R. 240.16a-1(f). Identification of an executive officer for purposes of this Policy shall include at a minimum executive officers identified pursuant to 17 C.F.R. 229.401(b).
“Exchange Act” shall mean the Securities Exchange Act of 1934, as amended.
“Financial Reporting Measures” shall mean measures that are determined and presented in accordance with the accounting principles used in preparing the Company’s financial statements, and any measures that are derived wholly or in part from such measures. Stock price and total shareholder return (and any measures that are derived wholly or in part from stock price or total shareholder return) shall for purposes of this Policy be considered Financial Reporting Measures. For the avoidance of doubt, a Financial Reporting Measure need not be presented in the Company’s financial statements or included in a filing with the SEC.
“Incentive-Based Compensation” shall mean any compensation that is granted, earned, or vested based wholly or in part upon the attainment of a Financial Reporting Measure.
“NYSE” shall mean The New York Stock Exchange.
2
Exhibit 97
“Policy” shall mean this Senior Executive Compensation Recovery Policy, as the same may be amended or restated from time to time.
“Received” shall, with respect to any Incentive-Based Compensation, mean actual or deemed receipt by the Covered Individual. Incentive-Based Compensation shall be deemed received in the Company’s fiscal period during which the Financial Reporting Measure specified in the Incentive-Based Compensation award or applicable granting policy is attained, even if payment or grant of the Incentive-Based Compensation occurs after the end of that period.
“Restatement Date” shall mean the earlier to occur of (i) the date the Board of Directors, a committee of the Board of Directors, or the officers of the Company authorized to take such action if Board of Directors’ action is not required, concludes, or reasonably should have concluded, that the Company is required to prepare an Accounting Restatement, or (ii) the date a court, regulator, or other legally authorized body directs the Company to prepare an Accounting Restatement.
“SEC” shall mean the U.S. Securities and Exchange Commission.
3
Exhibit 97
The Company shall file all disclosures with respect to this Policy in accordance with the requirements of the federal securities laws, including the disclosure required by the applicable SEC filings.
The Company Group shall not be permitted to indemnify any Covered Individual against (i) the loss of any Erroneously Awarded Compensation that is repaid, returned, or recovered pursuant to the terms of this Policy, or (ii) any claims relating to the Company Group’s
4
Exhibit 97
enforcement of its rights under this Policy. Further, the Company Group shall not enter into any agreement that exempts any Incentive-Based Compensation from the application of this Policy or that waives the Company Group’s right to recovery of any Erroneously Awarded Compensation and this Policy shall supersede any such agreement (whether entered into before, on, or after the date this Policy was adopted).
The Committee is authorized to interpret and construe this Policy and to make all determinations necessary, appropriate, or advisable for the administration of this Policy.
The Committee may amend this Policy from time to time in its discretion and shall amend this Policy as it deems necessary, including as and when it determines that it is legally required by any federal securities laws, SEC rule or the rules of any national securities exchange or national securities association on which the Company’s securities are listed. The Committee may terminate this Policy at any time. Notwithstanding anything in this paragraph to the contrary, no amendment or termination of this Policy shall be effective if such amendment or termination would (after taking into account any actions taken by the Company contemporaneously with such amendment or termination) cause the Company to violate any federal securities laws, SEC rule or the rules of any national securities exchange or national securities association on which the Company’s securities are listed.
The Committee intends that this Policy will be applied to the fullest extent of the law. The Committee may require that any incentive compensation agreement, equity award agreement, or any other agreement entered into on or after the date of adoption of this Policy shall, as a condition to the grant of any benefit thereunder, require a Covered Individual to agree to abide by the terms of this Policy. Any right of recoupment under this Policy is in addition to, and not in lieu of, any other remedies or rights of recoupment that may be available to the Company Group under applicable law, regulation, or rule or pursuant to the terms of any similar policy in any employment agreement, equity award agreement, or similar agreement and any other legal remedies available to the Company. Notwithstanding the preceding sentence, upon the Effective Date of this Policy, this Policy shall supersede and replace that certain Incentive Compensation Clawback Policy adopted by the Company on July 31, 2012. For the avoidance of doubt, any Covered Individual that is subject to this Policy shall not also be subject to the terms of the Company’s Broad-Based Compensation Recovery Policy and this Policy shall govern the terms of any recovery of Incentive-Based Compensation Received by such Covered Individual.
This Policy shall be binding and enforceable against all Covered Individuals and their beneficiaries, heirs, executors, administrators, or other legal representatives.
5
Exhibit 97
* * * * *
6